

Photo Credit: gpointstudio / Shutterstock
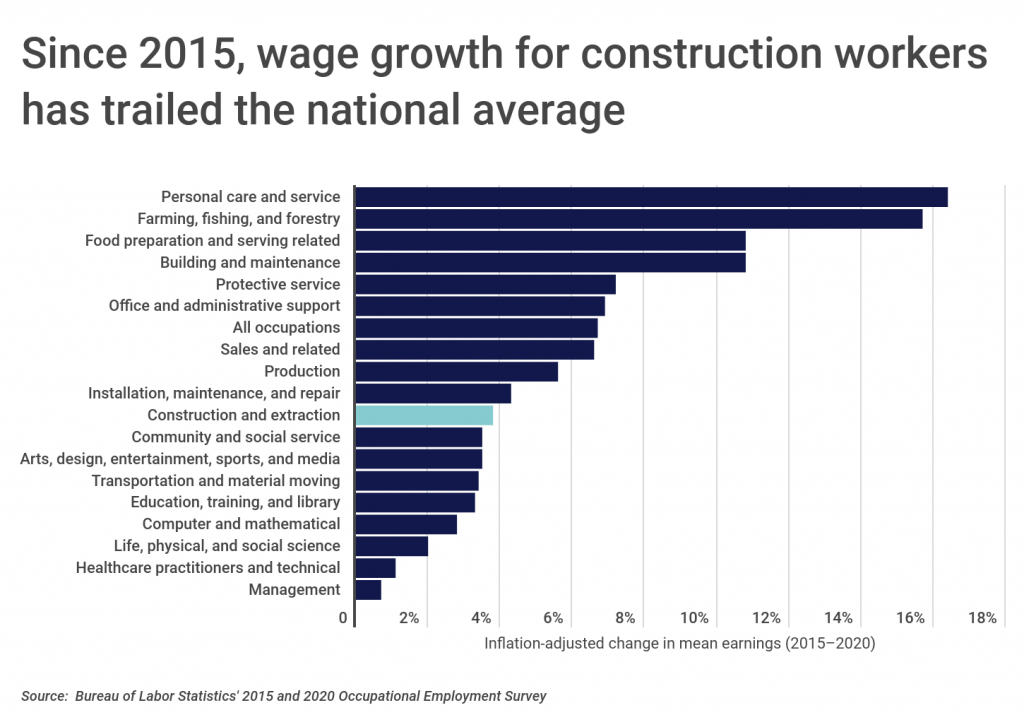
The construction industry took a huge hit in 2020 due to pandemic-induced shutdowns and work stoppages. While construction is now booming in many cities across the country due to pent-up demand for new homes and low interest rates, construction employment has still not returned to pre-pandemic levels. According to data from the Bureau of Labor Statistics (BLS), average wages for construction workers increased by 3.8% from 2015 to 2020, after adjusting for inflation, and increased demand for construction workers will likely push wages higher over the next year.
This is good news for those in the construction industry, many of whom experienced below-average wage growth in recent years. Across all occupations, inflation-adjusted wages grew by 6.7% between 2015 and 2020. While construction wages grew more slowly, at less than 4%, the construction industry varies substantially across the country. In some cities, construction wage growth over the last five years was greater than, or on par with, that of the fastest-growing occupational groups, such as personal care (+16.4%) and farming, fishing, and forestry (+15.7%).
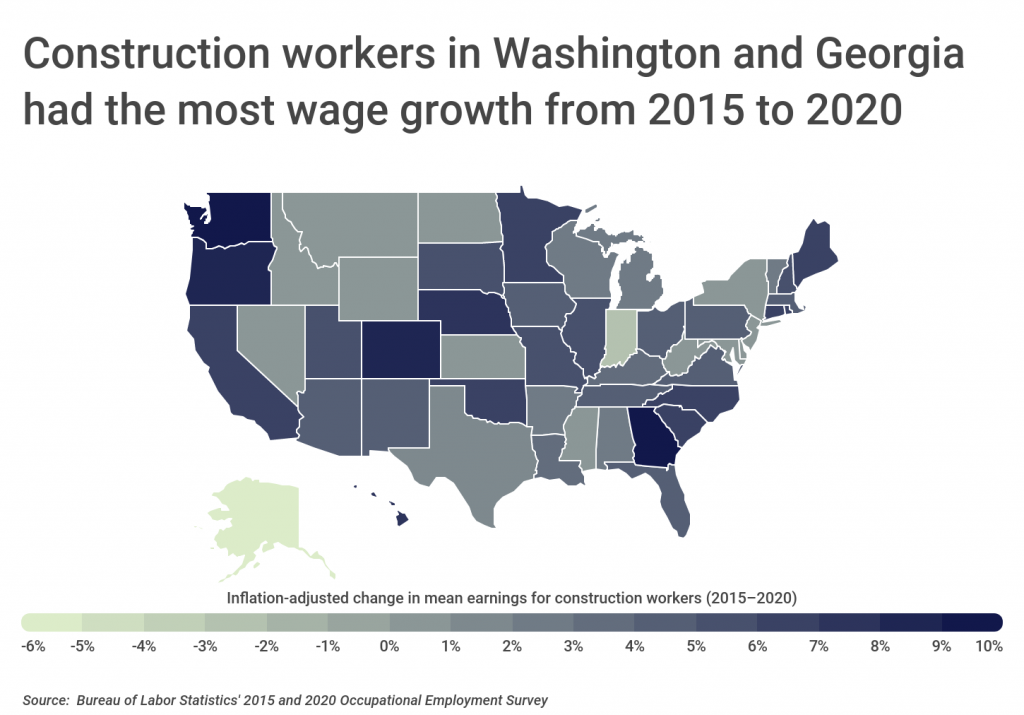
At the state level, construction workers in Washington and Georgia had the fastest-growing wages from 2015 to 2020, increasing by 10% and 9.1%, respectively, after adjusting for inflation. Compared to the national population growth rate of 2.7% from 2015 to 2020, both Washington and Georgia grew at faster rates (by 7.3% and 5.2%, respectively). Conversely, construction workers in Indiana and Alaska (Indiana reported below-average population growth and Alaska’s population declined) saw their construction worker wages decline by 2.7% and 5.7%, respectively.
To find the metropolitan areas with the fastest-growing wages for construction workers, researchers at Construction Coverage analyzed the latest data from the BLS. The researchers ranked metro areas according to the inflation-adjusted change in mean construction worker earnings from 2015 to 2020. Researchers also calculated the actual change in mean earnings from 2015 to 2020, mean annual earnings for 2020 and 2015, and the concentration of construction workers compared to the national average.
Here are the metropolitan areas with the fastest-growing wages for construction workers.
Large Metros With the Fastest-Growing Wages for Construction Workers

Photo Credit: Songquan Deng / Shutterstock
15. Orlando-Kissimmee-Sanford, FL
- Inflation-adjusted change in mean earnings (2015–2020): 6.8%
- Actual change in mean earnings (2015–2020): 16.7%
- Mean annual earnings (2020): $43,560
- Mean annual earnings (2015): $37,340
- Concentration of construction workers (compared to average): +14%
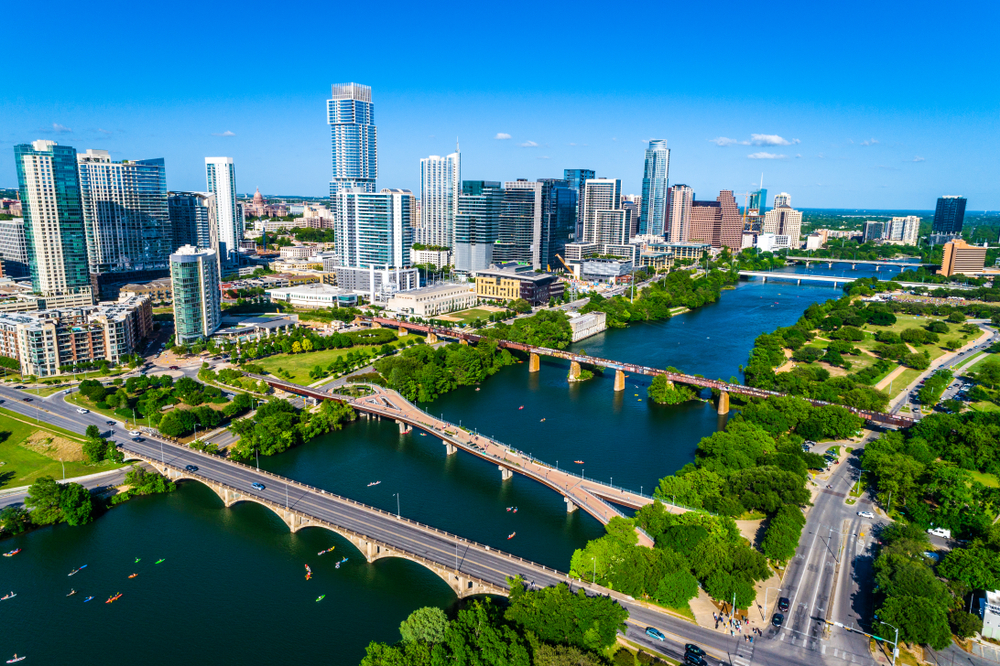
Photo Credit: Roschetzky Photography / Shutterstock
14. Austin-Round Rock, TX
- Inflation-adjusted change in mean earnings (2015–2020): 7.1%
- Actual change in mean earnings (2015–2020): 16.9%
- Mean annual earnings (2020): $45,630
- Mean annual earnings (2015): $39,020
- Concentration of construction workers (compared to average): -1%
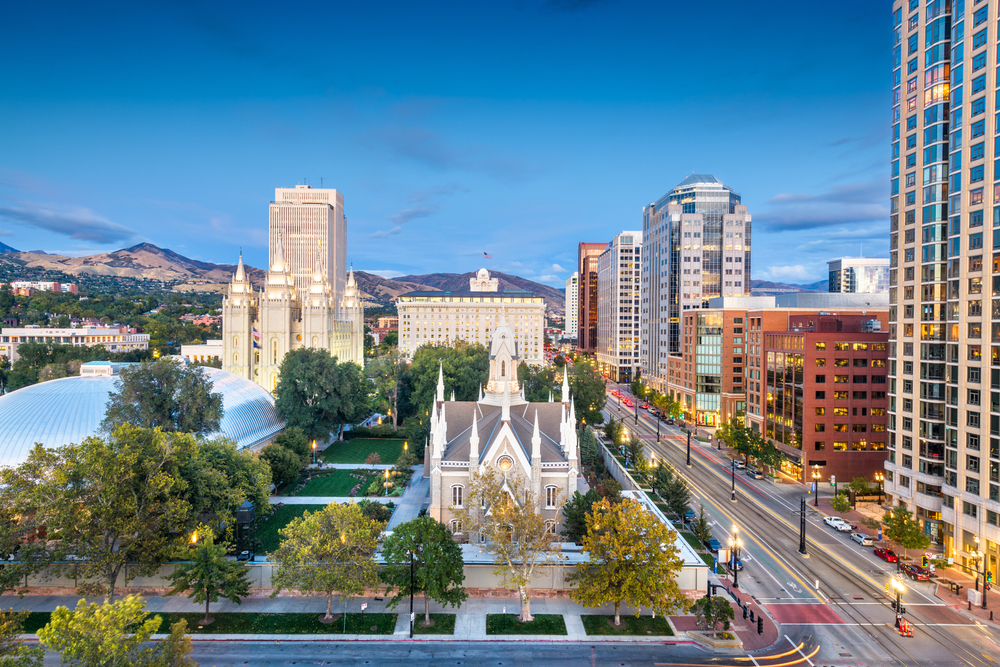
Photo Credit: Sean Pavone / Shutterstock
13. Salt Lake City, UT
- Inflation-adjusted change in mean earnings (2015–2020): 7.2%
- Actual change in mean earnings (2015–2020): 17.0%
- Mean annual earnings (2020): $50,350
- Mean annual earnings (2015): $43,030
- Concentration of construction workers (compared to average): +26%

Photo Credit: Jon Bilous / Shutterstock
12. Hartford-West Hartford-East Hartford, CT
- Inflation-adjusted change in mean earnings (2015–2020): 7.3%
- Actual change in mean earnings (2015–2020): 17.2%
- Mean annual earnings (2020): $62,320
- Mean annual earnings (2015): $53,190
- Concentration of construction workers (compared to average): -36%

Photo Credit: Sean Pavone / Shutterstock
11. Oklahoma City, OK
- Inflation-adjusted change in mean earnings (2015–2020): 7.4%
- Actual change in mean earnings (2015–2020): 17.3%
- Mean annual earnings (2020): $48,880
- Mean annual earnings (2015): $41,670
- Concentration of construction workers (compared to average): +27%
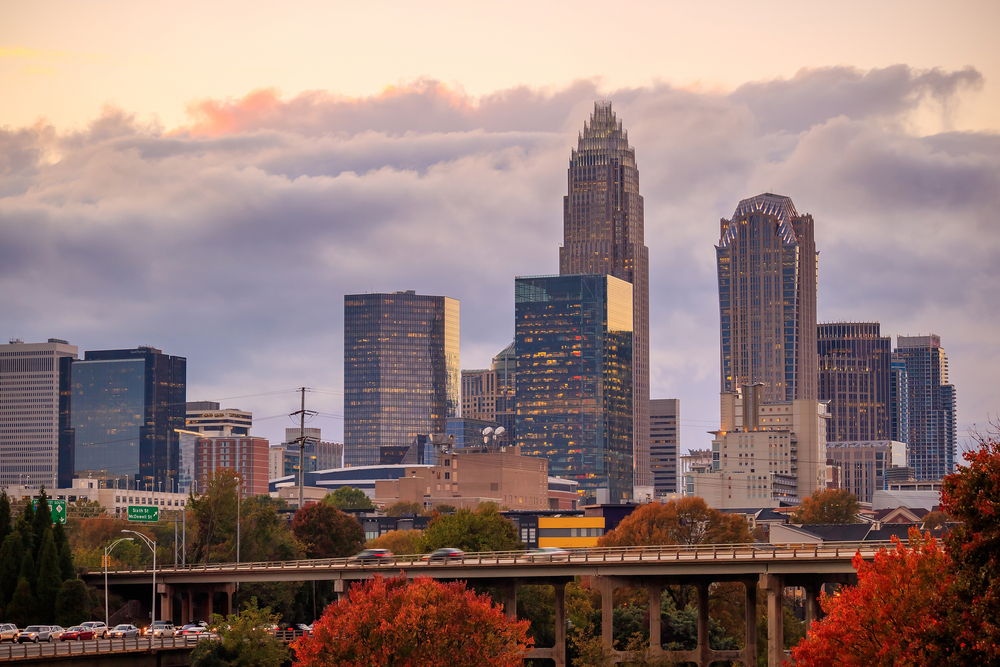
Photo Credit: f11photo / Shutterstock
10. Charlotte-Concord-Gastonia, NC-SC
- Inflation-adjusted change in mean earnings (2015–2020): 7.5%
- Actual change in mean earnings (2015–2020): 17.3%
- Mean annual earnings (2020): $44,870
- Mean annual earnings (2015): $38,240
- Concentration of construction workers (compared to average): +7%

Photo Credit: Richard Cavalleri / Shutterstock
9. Providence-Warwick, RI-MA
- Inflation-adjusted change in mean earnings (2015–2020): 8.1%
- Actual change in mean earnings (2015–2020): 18.0%
- Mean annual earnings (2020): $58,370
- Mean annual earnings (2015): $49,460
- Concentration of construction workers (compared to average): -11%

Photo Credit: Sean Pavone / Shutterstock
8. Louisville/Jefferson County, KY-IN
- Inflation-adjusted change in mean earnings (2015–2020): 8.1%
- Actual change in mean earnings (2015–2020): 18.1%
- Mean annual earnings (2020): $51,650
- Mean annual earnings (2015): $43,740
- Concentration of construction workers (compared to average): -16%

Photo Credit: Sean Pavone / Shutterstock
7. Raleigh, NC
- Inflation-adjusted change in mean earnings (2015–2020): 8.2%
- Actual change in mean earnings (2015–2020): 18.2%
- Mean annual earnings (2020): $46,400
- Mean annual earnings (2015): $39,260
- Concentration of construction workers (compared to average): +6%
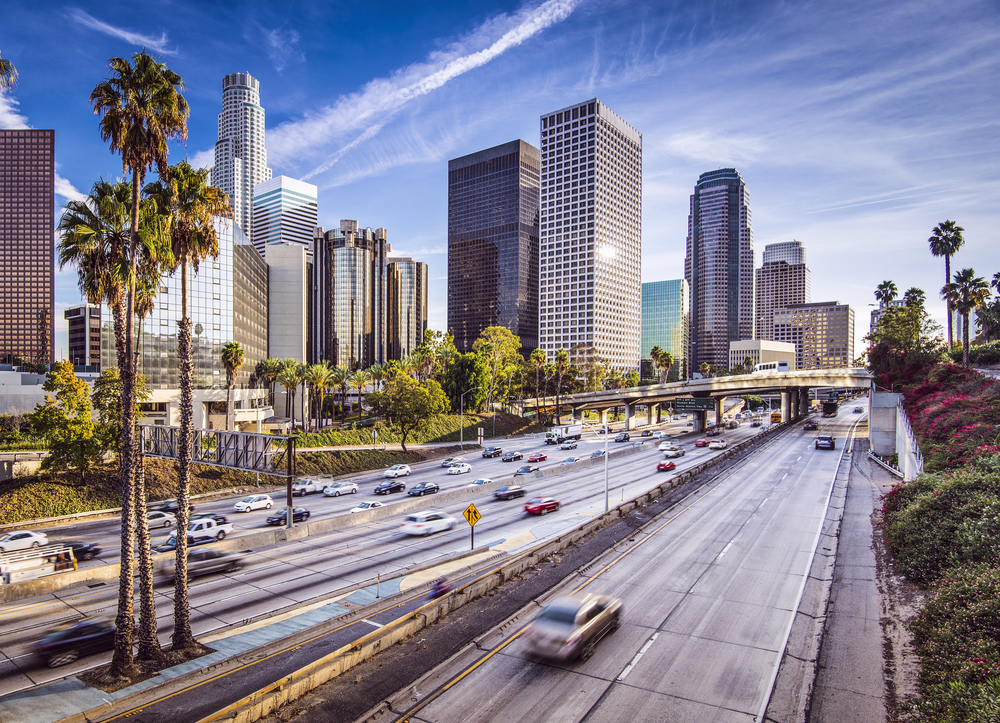
Photo Credit: Sean Pavone / Shutterstock
6. Los Angeles-Long Beach-Anaheim, CA
- Inflation-adjusted change in mean earnings (2015–2020): 8.9%
- Actual change in mean earnings (2015–2020): 18.9%
- Mean annual earnings (2020): $63,600
- Mean annual earnings (2015): $53,490
- Concentration of construction workers (compared to average): -22%
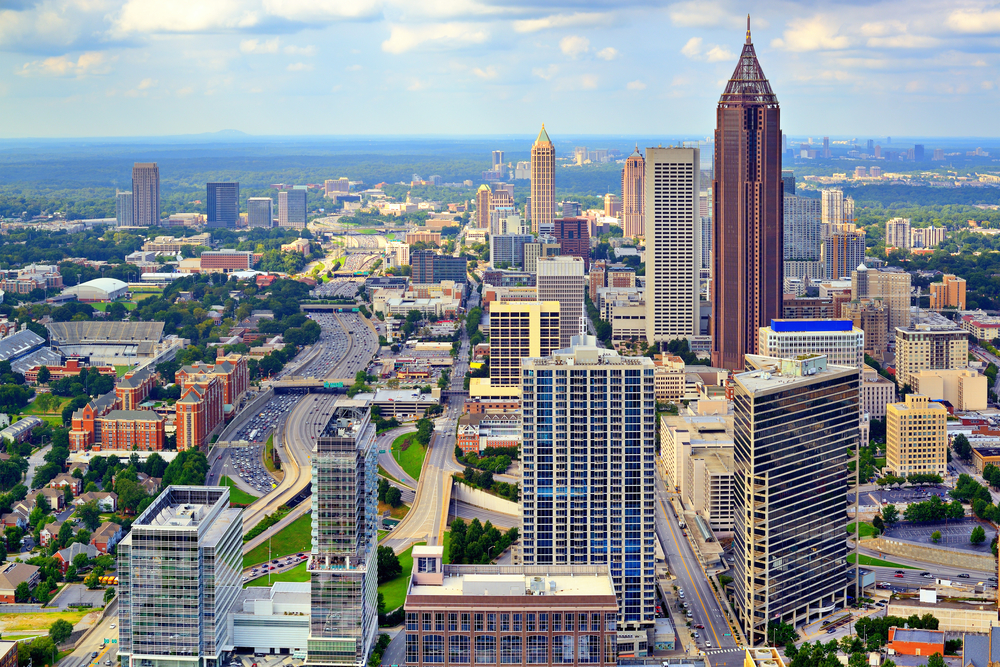
Photo Credit: ESB Professional / Shutterstock
5. Atlanta-Sandy Springs-Roswell, GA
- Inflation-adjusted change in mean earnings (2015–2020): 9.1%
- Actual change in mean earnings (2015–2020): 19.1%
- Mean annual earnings (2020): $47,660
- Mean annual earnings (2015): $40,010
- Concentration of construction workers (compared to average): -28%

Photo Credit: Jon Bilous / Shutterstock
4. Portland-Vancouver-Hillsboro, OR-WA
- Inflation-adjusted change in mean earnings (2015–2020): 9.3%
- Actual change in mean earnings (2015–2020): 19.4%
- Mean annual earnings (2020): $63,240
- Mean annual earnings (2015): $52,980
- Concentration of construction workers (compared to average): +16%

Photo Credit: Bogdan Vacarciuc / Shutterstock
3. San Francisco-Oakland-Hayward, CA
- Inflation-adjusted change in mean earnings (2015–2020): 9.4%
- Actual change in mean earnings (2015–2020): 19.4%
- Mean annual earnings (2020): $78,750
- Mean annual earnings (2015): $65,940
- Concentration of construction workers (compared to average): -5%

Photo Credit: Nicholas Courtney / Shutterstock
2. Denver-Aurora-Lakewood, CO
- Inflation-adjusted change in mean earnings (2015–2020): 10.2%
- Actual change in mean earnings (2015–2020): 20.4%
- Mean annual earnings (2020): $55,400
- Mean annual earnings (2015): $46,020
- Concentration of construction workers (compared to average): +16%
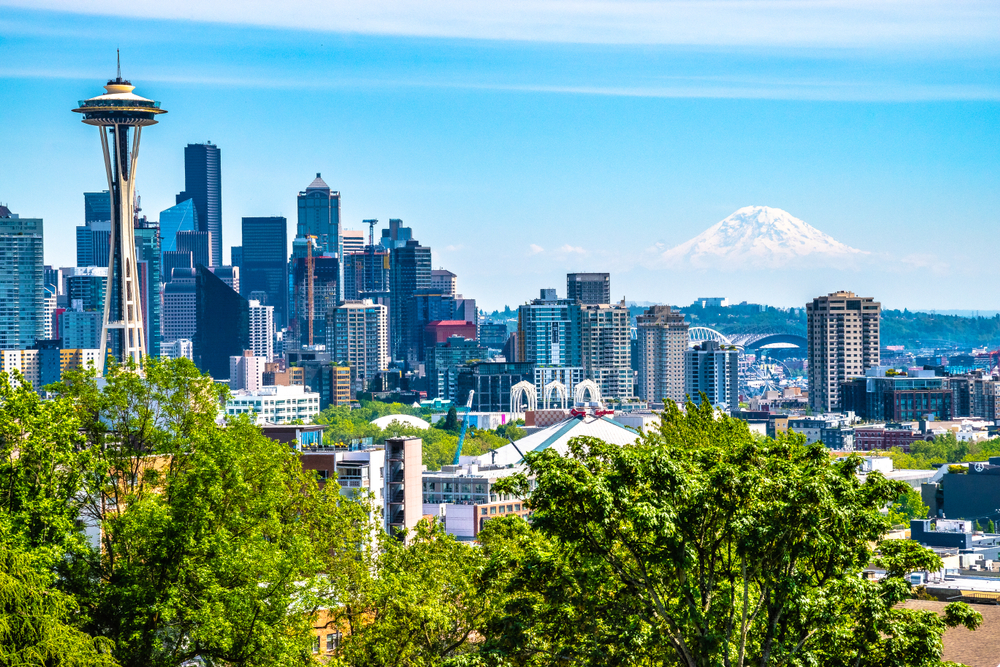
Photo Credit: Jeremy Janus / Shutterstock
1. Seattle-Tacoma-Bellevue, WA
- Inflation-adjusted change in mean earnings (2015–2020): 12.4%
- Actual change in mean earnings (2015–2020): 22.8%
- Mean annual earnings (2020): $71,840
- Mean annual earnings (2015): $58,520
- Concentration of construction workers (compared to average): +10%
Detailed Findings & Methodology
While the large metros with the fastest-growing wages for construction workers are scattered across the country, five out of the top six are located on the West Coast. At the national level, the average wage for construction workers in 2020 was $53,940, but the numbers were far higher in certain areas. For example, construction workers in the San Francisco metro area earned an average wage of nearly $79,000, an increase of 9.4% over 2015 after adjusting for inflation.
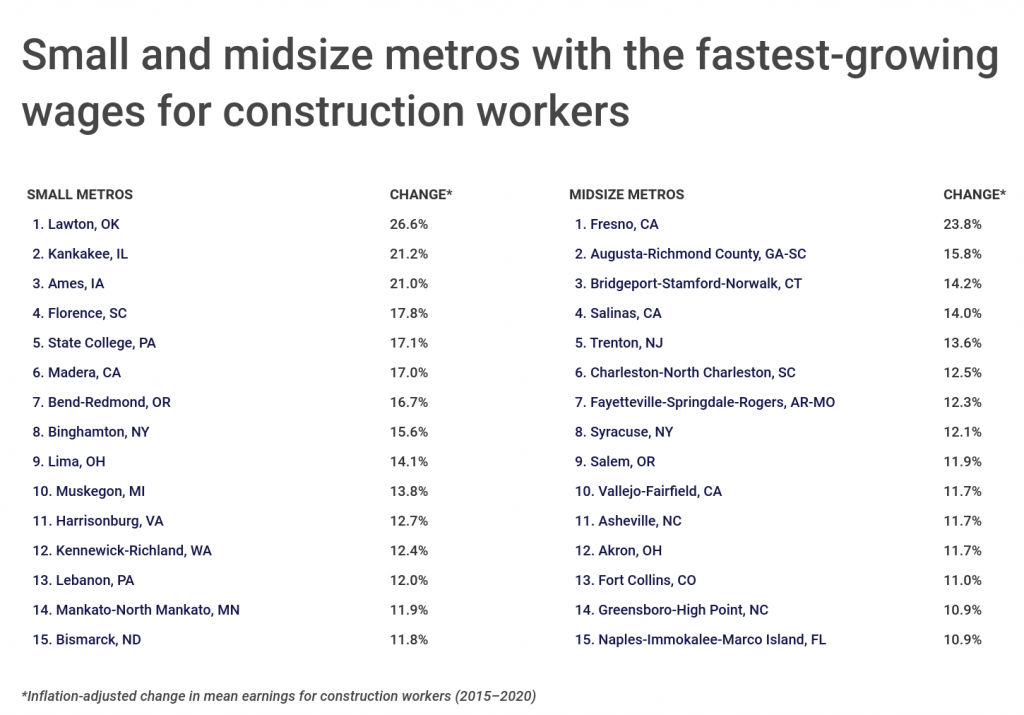
Among small and midsize metros with the fastest-growing wages for construction workers, the Lawton, OK metro area reported the most growth at 26.6%. Local concentrations of construction workers vary widely among the top small and midsize metros, from as high as 90% above the national share (Kennewick-Richland, WA) to as low as 54% below the national share (Trenton, NJ).
To find the locations with the fastest-growing wages for construction workers, researchers at Construction Coverage analyzed the latest data from the U.S. Bureau of Labor Statistics Occupational Employment and Wage Statistics. The researchers ranked locations according to the inflation-adjusted change in mean construction worker earnings from 2015 to 2020. In the event of a tie, the metro with the higher earnings for 2020 was ranked higher. Researchers also calculated the actual change in mean earnings from 2015 to 2020, mean annual earnings for 2020 and 2015, and the concentration of construction workers compared to the national share. All wage changes reported are statistically significant at a 90% confidence level.
To improve relevance, only metropolitan areas with at least 100,000 people were included in the analysis. Additionally, metro areas were grouped into the following cohorts based on population size:
- Small metros: 100,000–349,999
- Midsize metros: 350,000–999,999
- Large metros: 1,000,000 or more