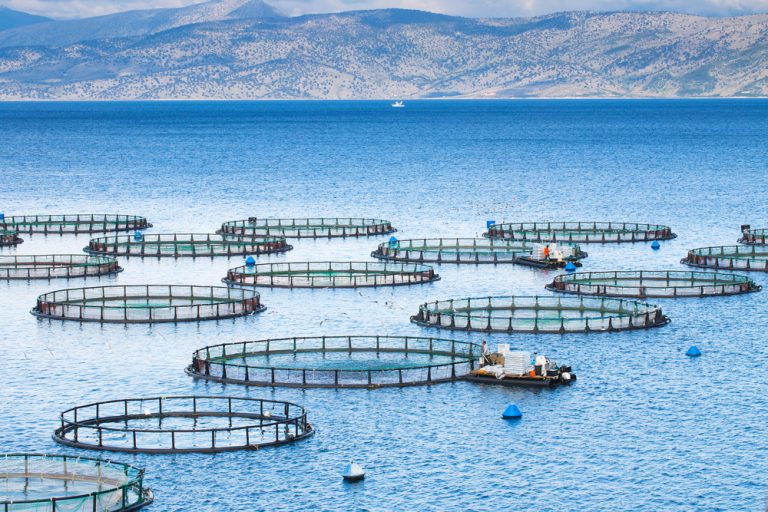
Photo Credit: Sodel Vladyslav / Shutterstock
With the planet’s population growing and the global market for seafood steadily increasing, natural fish production from the world’s lakes, rivers, and oceans will be insufficient to keep up with demand in the long term. To support global demand, aquaculture is a critical resource for raising seafood efficiently and sustainably.
The USDA defines aquaculture as the farming of aquatic organisms, including fish, crustaceans, mollusks, and more. The farming process includes seeding, stocking, and feeding fish, shellfish, and other aquatic products in a controlled environment. The controlled environment makes aquaculture distinct from wild caught seafood taken from a natural habitat.
Aquaculture in the U.S. represents a $1.5 billion industry annually and helps support 1.7 million jobs in the broader seafood industry, according to estimates from the National Oceanic and Atmospheric Administration. These figures place the U.S. relatively low on a global scale as an aquaculture producer—17th in total aquaculture production—but the U.S. is one of the top consumers of aquaculture imports. More than 90% of seafood in the U.S. comes from outside of the country, and around half of that total comes from farm-raised seafood.
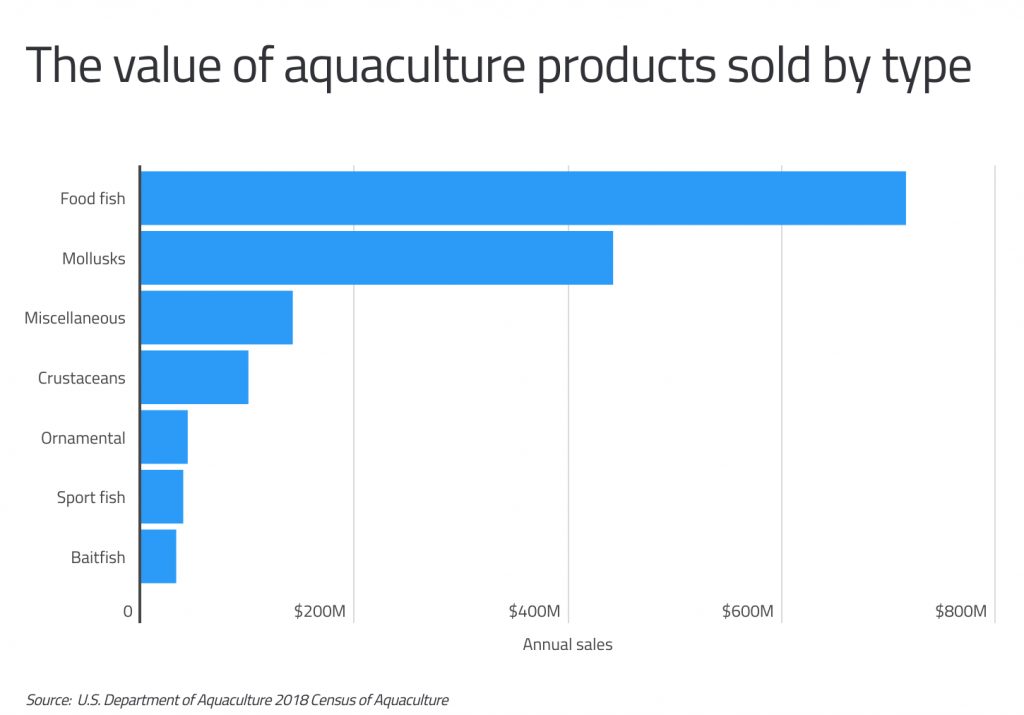
Aquaculture products in the U.S. that generate the most sales fall in the categories of food fish and mollusks. Food fish—a category that includes any fish raised primarily for food, such as catfish, sturgeon, tilapia, trout, or salmon—accounts for nearly half of the aquaculture market by itself, with $716 million in sales each year. Mollusks—which are marine invertebrates like clams, mussels, and oysters also commonly raised as food—follow behind at $442 million sold each year.
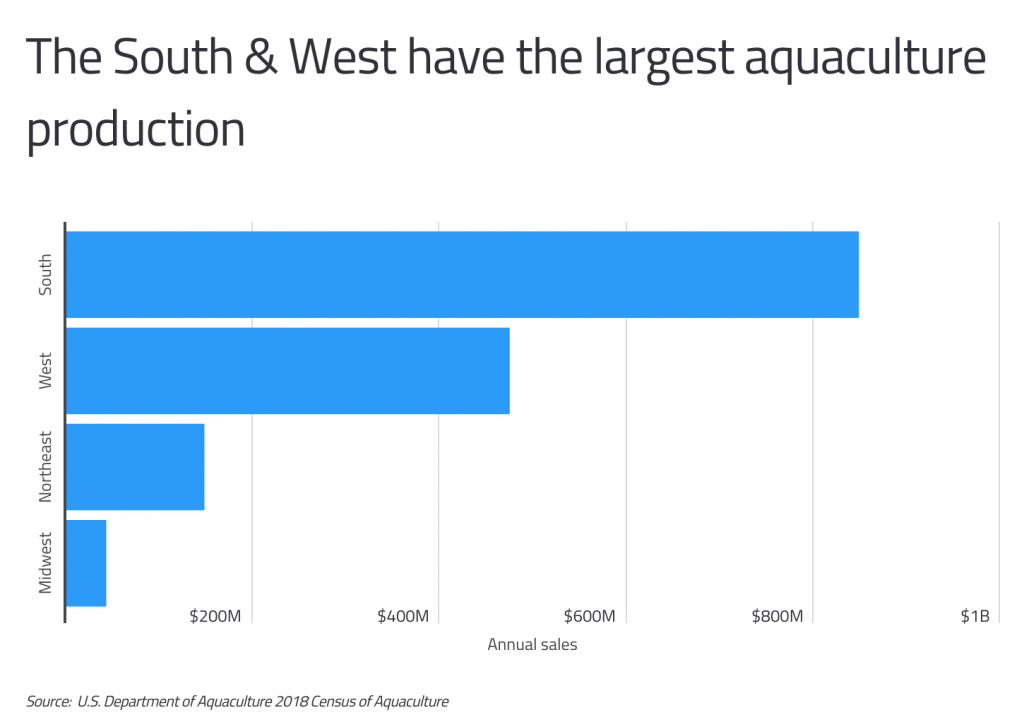
Naturally, a successful aquaculture industry depends on access to geographic features that support production. This means that some regions of the U.S. are more conducive to aquaculture than others. The South leads the U.S. in production, with nearly $850 million in annual sales from aquaculture. This can be attributed to strong production of freshwater fish, especially catfish, in the areas around the Mississippi River watershed, and saltwater production in the Gulf of Mexico and Atlantic Ocean. The West produces $475 million in aquaculture sales each year, primarily from Washington and California, which are leaders in shellfish production but also have strong saltwater and freshwater production of fish like trout, tilapia, and salmon.
The data used in this analysis is from the USDA’s Census of Aquaculture. To identify the states with the most aquaculture production, researchers at Commodity.com ranked states based on the total value of aquaculture products sold. Aquaculture products include food fish, sport fish, baitfish, and ornamental fish, as well as mollusks, crustaceans, and other miscellaneous aquaculture products. The total acreage by state reported in this study is the sum of freshwater and saltwater production (where available), and the most common water source is the water source characteristic of the greatest number of farms in each state.
Here are the states with the largest aquaculture industry.
U.S. States With the Most Aquaculture Production
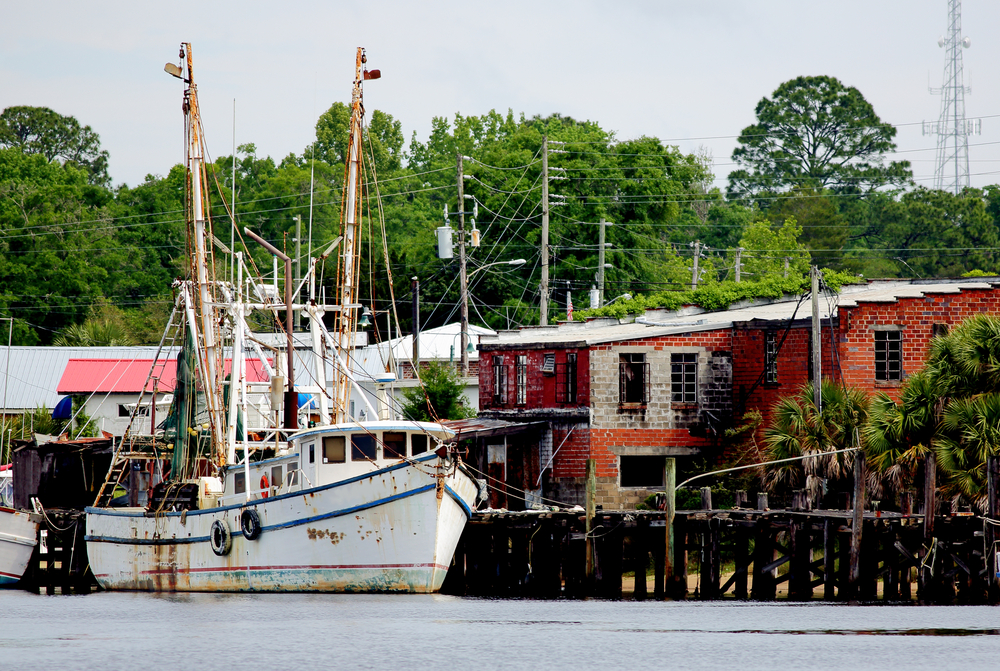
Photo Credit: John Wijsman / Shutterstock
15. North Carolina
- Total value of aquaculture products sold: $26,006,000
- Total number of aquaculture farms: 137
- Total acres: 2,909
- Most common water source: Groundwater

Photo Credit: grandbrothers / Shutterstock
14. Maryland
- Total value of aquaculture products sold: $28,139,000
- Total number of aquaculture farms: 43
- Total acres: 2,318
- Most common water source: Saltwater

Photo Credit: Bob Pool / Shutterstock
13. Massachusetts
- Total value of aquaculture products sold: $28,858,000
- Total number of aquaculture farms: 180
- Total acres: 1,046
- Most common water source: Saltwater
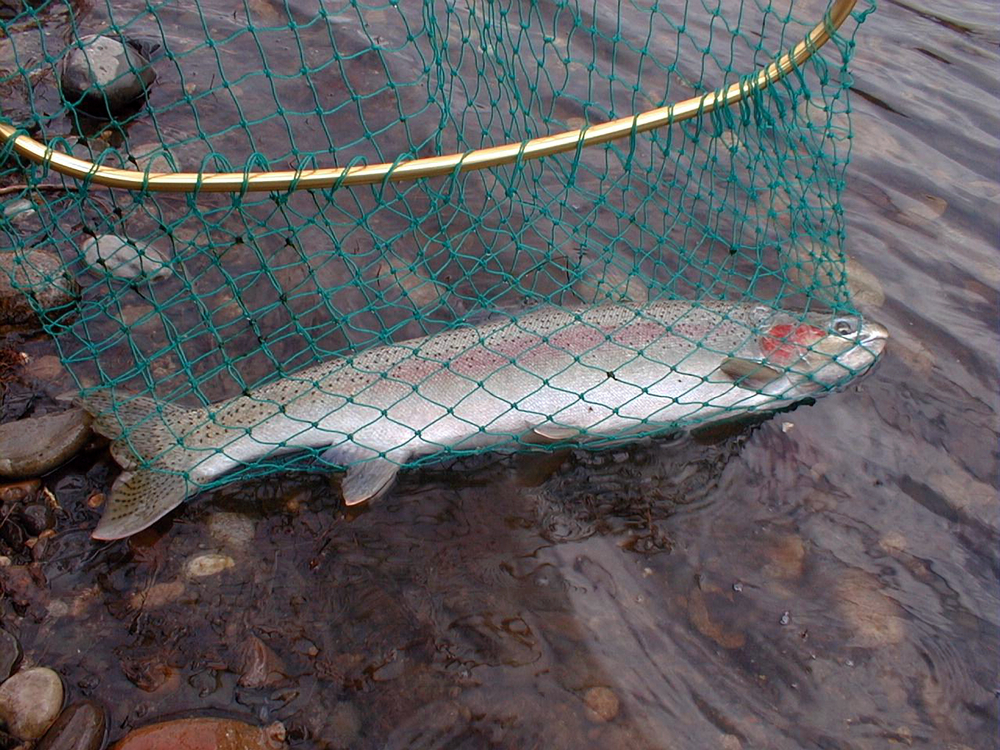
Photo Credit: jason merideth / Shutterstock
12. Idaho
- Total value of aquaculture products sold: $44,763,000
- Total number of aquaculture farms: 41
- Total acres: 498
- Most common water source: On-farm surface water

Photo Credit: JHDT Productions / Shutterstock
11. Texas
- Total value of aquaculture products sold: $62,594,000
- Total number of aquaculture farms: 107
- Total acres: 7,566
- Most common water source: Groundwater
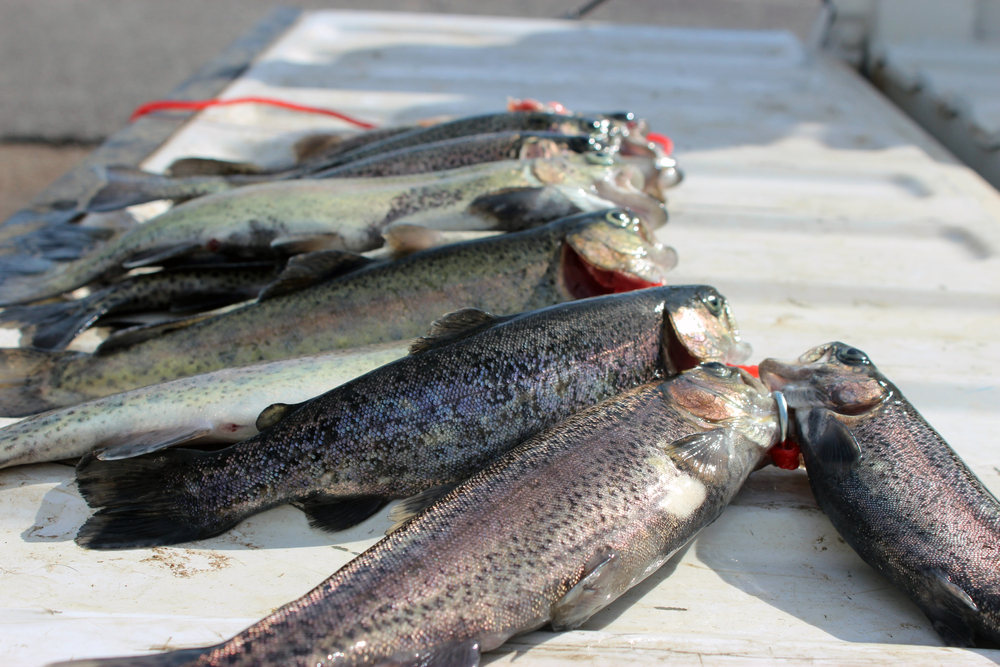
Photo Credit: Leeahn / Shutterstock
10. Arkansas
- Total value of aquaculture products sold: $67,661,000
- Total number of aquaculture farms: 82
- Total acres: 29,936
- Most common water source: Groundwater
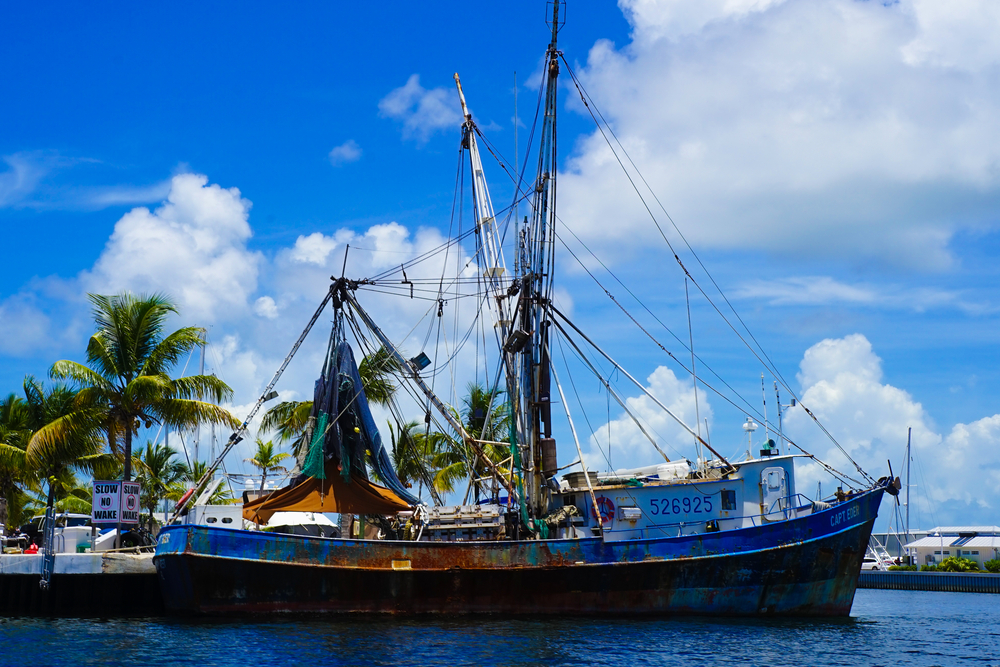
Photo Credit: Inspired By Maps / Shutterstock
9. Florida
- Total value of aquaculture products sold: $71,649,000
- Total number of aquaculture farms: 334
- Total acres: 3,410
- Most common water source: Saltwater
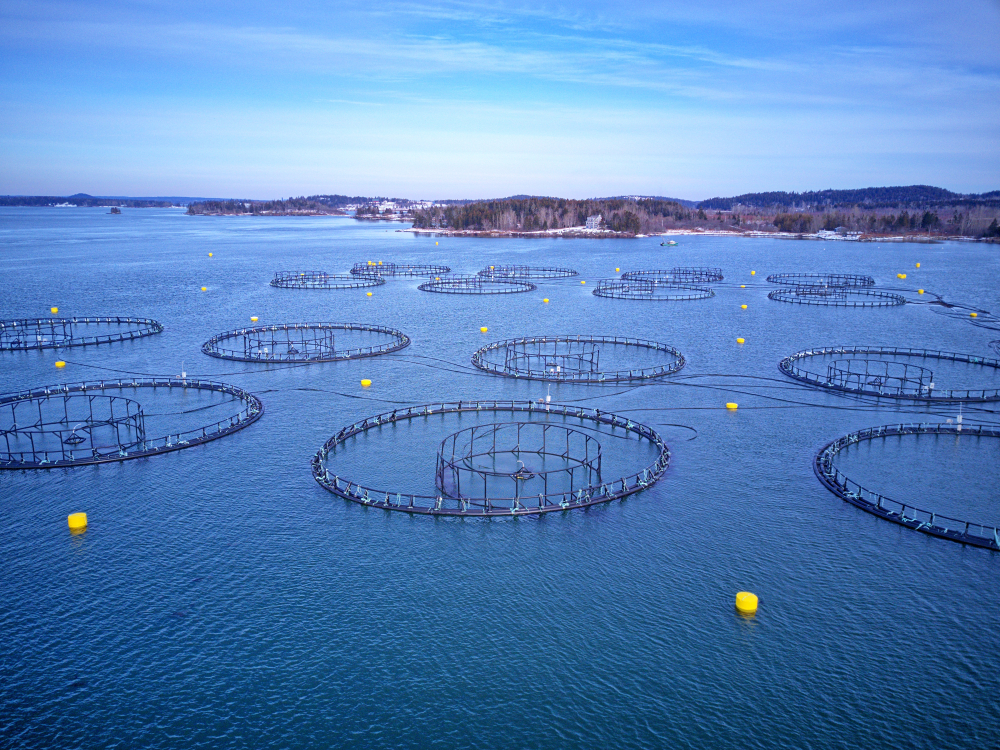
Photo Credit: leo w kowal / Shutterstock
8. Maine
- Total value of aquaculture products sold: $72,340,000
- Total number of aquaculture farms: 75
- Total acres: 1,295
- Most common water source: Saltwater

Photo Credit: norinori303 / Shutterstock
7. Hawaii
- Total value of aquaculture products sold: $78,429,000
- Total number of aquaculture farms: 49
- Total acres: 794
- Most common water source: Saltwater
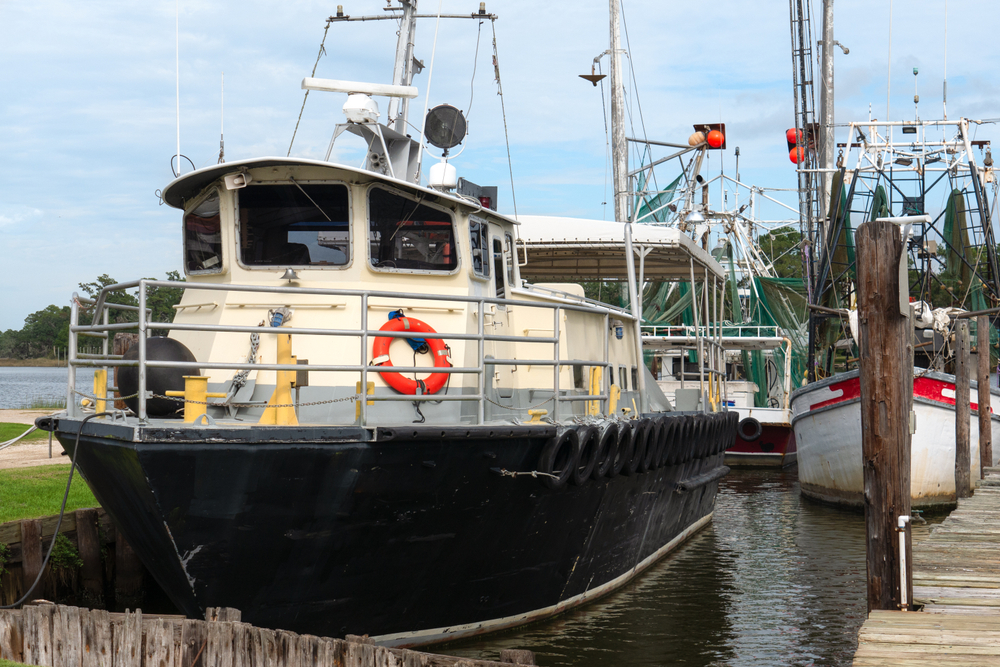
Photo Credit: Leigh Trail / Shutterstock
6. Alabama
- Total value of aquaculture products sold: $95,199,000
- Total number of aquaculture farms: 120
- Total acres: 17,591
- Most common water source: On-farm surface water
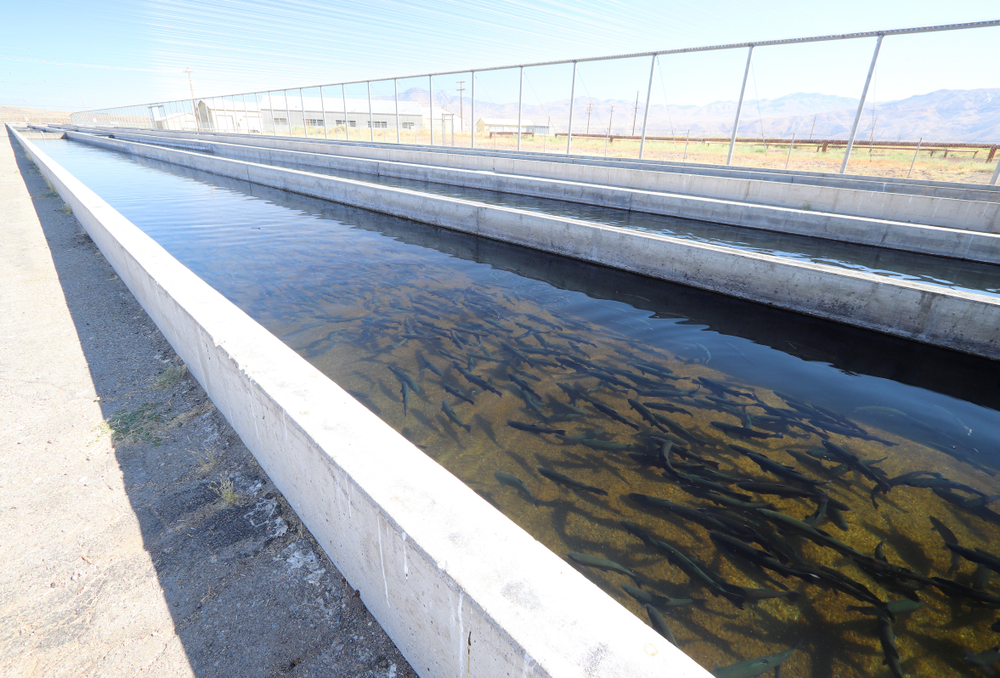
Photo Credit: Sean Lema / Shutterstock
5. California
- Total value of aquaculture products sold: $106,021,000
- Total number of aquaculture farms: 116
- Total acres: 11,329
- Most common water source: Groundwater
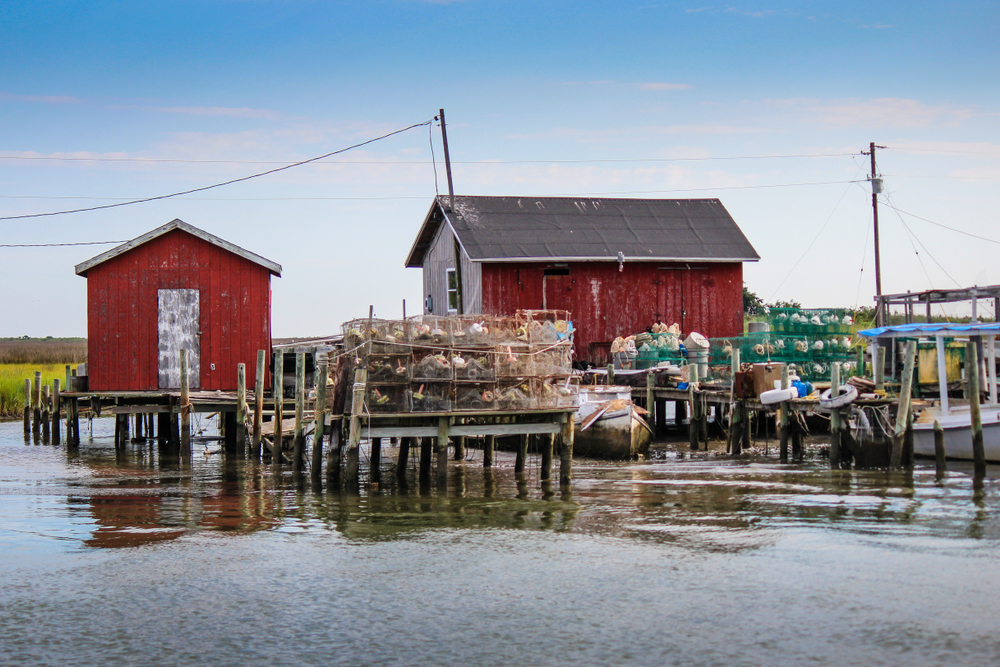
Photo Credit: Nicole R Young / Shutterstock
4. Virginia
- Total value of aquaculture products sold: $112,640,000
- Total number of aquaculture farms: 202
- Total acres: 17,797
- Most common water source: Saltwater
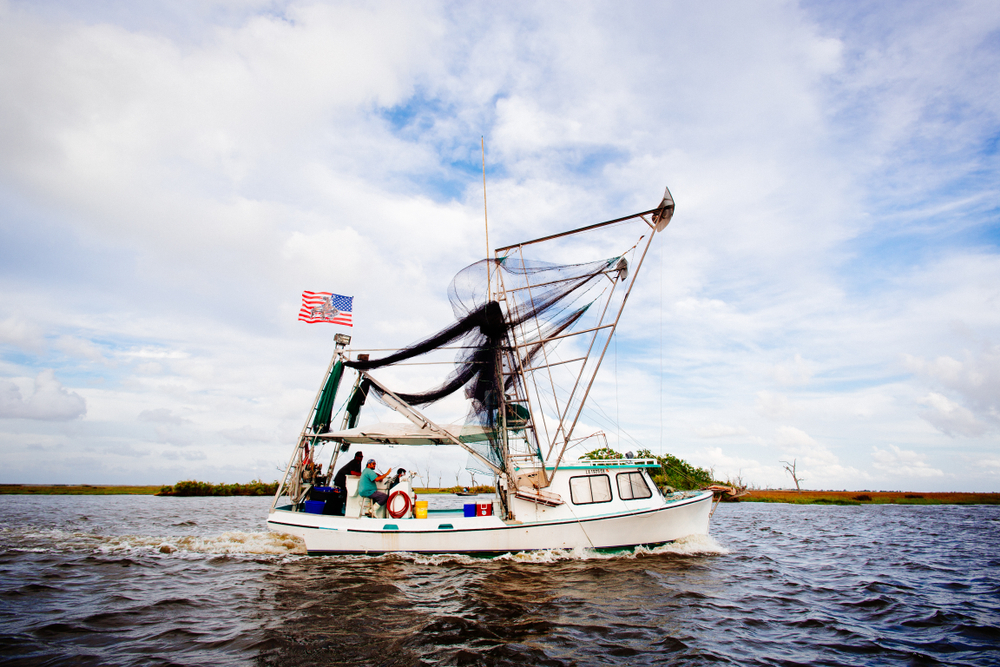
Photo Credit: Frank McMains / Shutterstock
3. Louisiana
- Total value of aquaculture products sold: $135,712,000
- Total number of aquaculture farms: 525
- Total acres: 240,274
- Most common water source: Groundwater
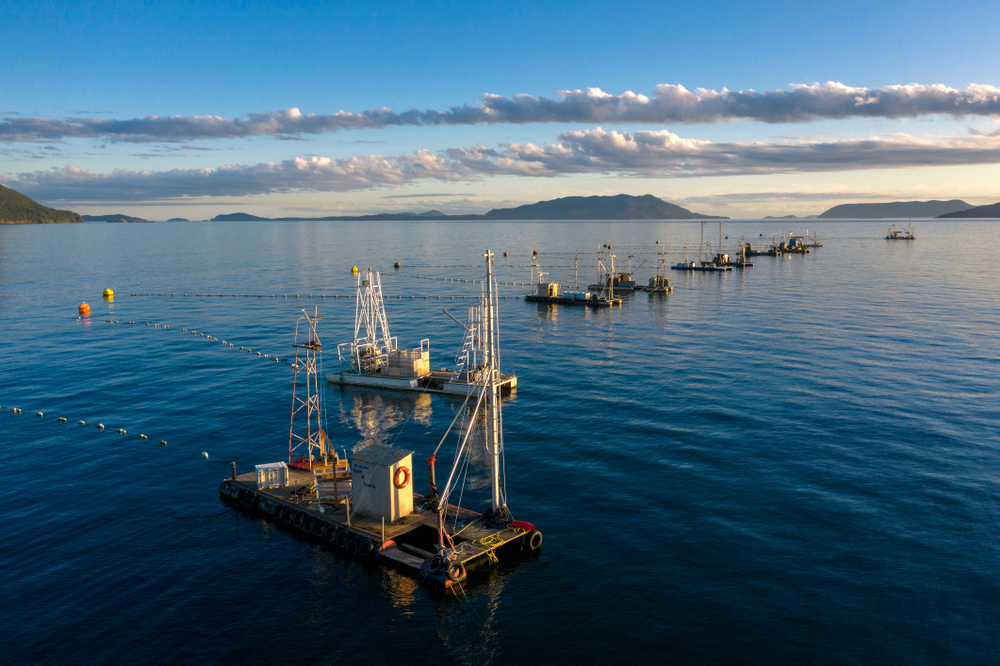
Photo Credit: Edmund Lowe Photography / Shutterstock
2. Washington
- Total value of aquaculture products sold: $207,685,000
- Total number of aquaculture farms: 151
- Total acres: 16,263
- Most common water source: Saltwater
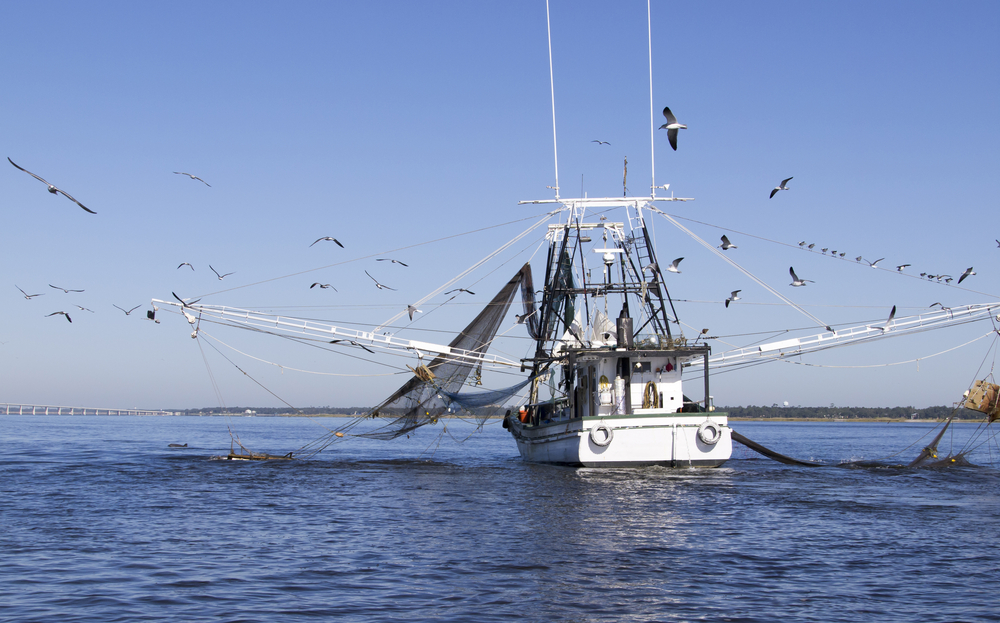
Photo Credit: Andrew B Hall / Shutterstock
1. Mississippi
- Total value of aquaculture products sold: $215,709,000
- Total number of aquaculture farms: 176
- Total acres: 39,561
- Most common water source: Groundwater
Methodology & Detailed Findings
The data used in this analysis is from the USDA’s 2018 Census of Aquaculture. To identify the states with the most aquaculture production, researchers ranked states based on the total value of aquaculture products sold. Aquaculture products include food fish, sport fish, baitfish, and ornamental fish, as well as mollusks, crustaceans, and other miscellaneous aquaculture products. For the purpose of this analysis, and as defined by the USDA, an aquaculture farm is any place with at least $1,000 worth of aquaculture products produced and sold or distributed during the census year. The total acreage by state reported in this study is the sum of freshwater and saltwater production (where available), and the most common water source is the water source characteristic of the greatest number of farms in each state.
Groundwater predominantly includes water from wells located on the farm or another farm; on-farm surface water includes streams, lakes, ponds, springs, or similar water sources located on or adjacent to the farm; off-farm water includes water from a federal supplier, commercial company, municipal water system, or similar source; and saltwater includes brackish water, tidal, sub-tidal, open public waterways, owned or leased.