
Photo Credit: Photo Smoothies / Shutterstock
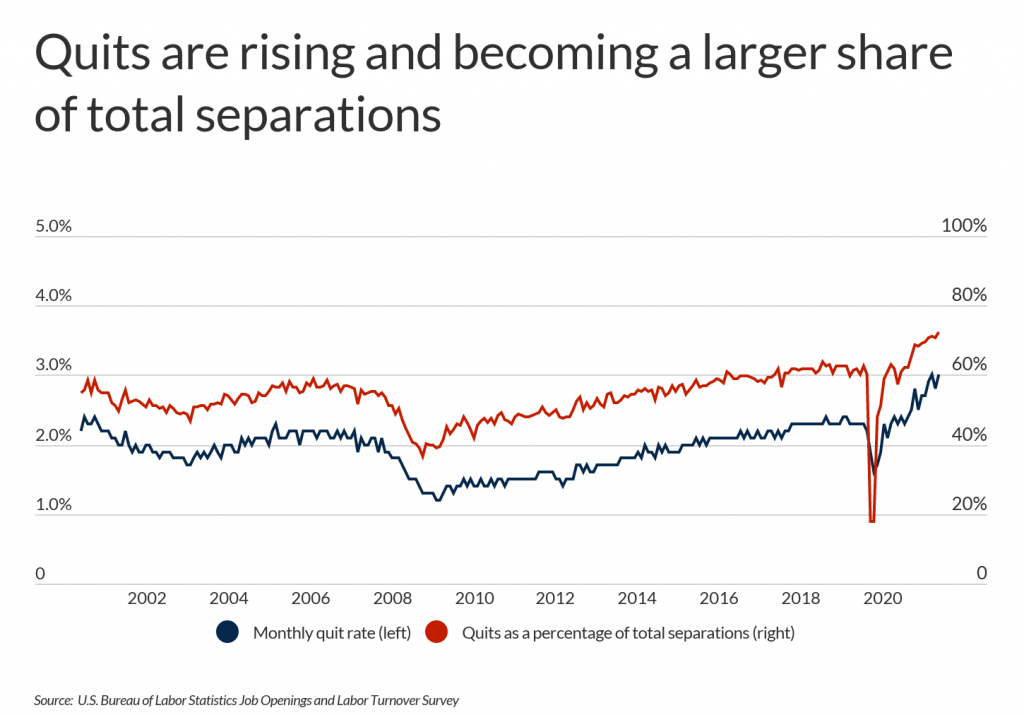
As workers continue to leave their jobs en masse, the phenomenon known as the “Great Resignation” seems to be far from over. According to data from the Bureau of Labor Statistics, quits totalled 4.5 million in November, a record high, and have been trending upward since April 2020. The quit rate—defined as the number of monthly quits as a percentage of total employment—rose to 3.0% in November, tying September’s record.
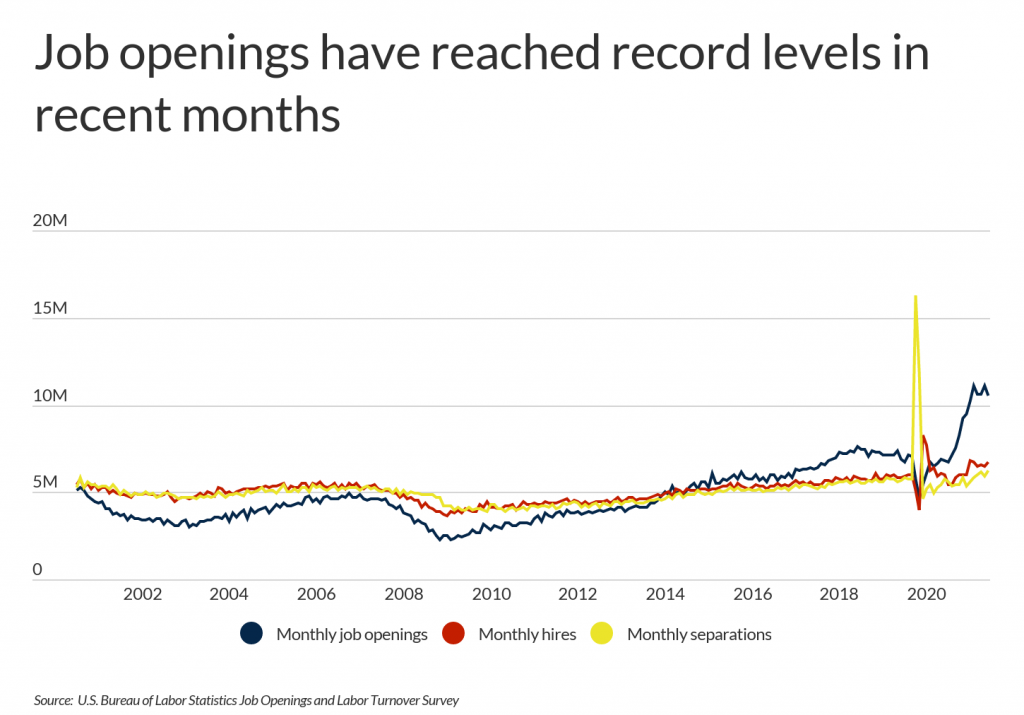
Historically, job openings, hires, and separations have tracked each other. However, the COVID-19 pandemic has disrupted this pattern. At the beginning of the pandemic in March 2020, total separations rose to a record 16.3 million as businesses across the country laid off workers and shut down. Separations were also high in April 2020 but then returned to more typical levels and have been trending upwards ever since. At the same time, job openings have been climbing rapidly, reaching near record levels in October 2021 amidst widespread labor shortages.
As businesses across the country struggle to hire, workers continue to quit in droves. Both total quits and quit rates have been rising since the spring of 2020, causing quits to account for an increasingly large share of total separations. The pandemic has caused many workers to reassess their priorities and look for jobs that offer more flexibility as well as better pay and benefits. Fortunately for them, the current labor market puts workers in a good position to make headway on these goals. Job openings currently total 10.6 million, and with 6.9 million unemployed workers, there are about 1.5 jobs per every unemployed worker.
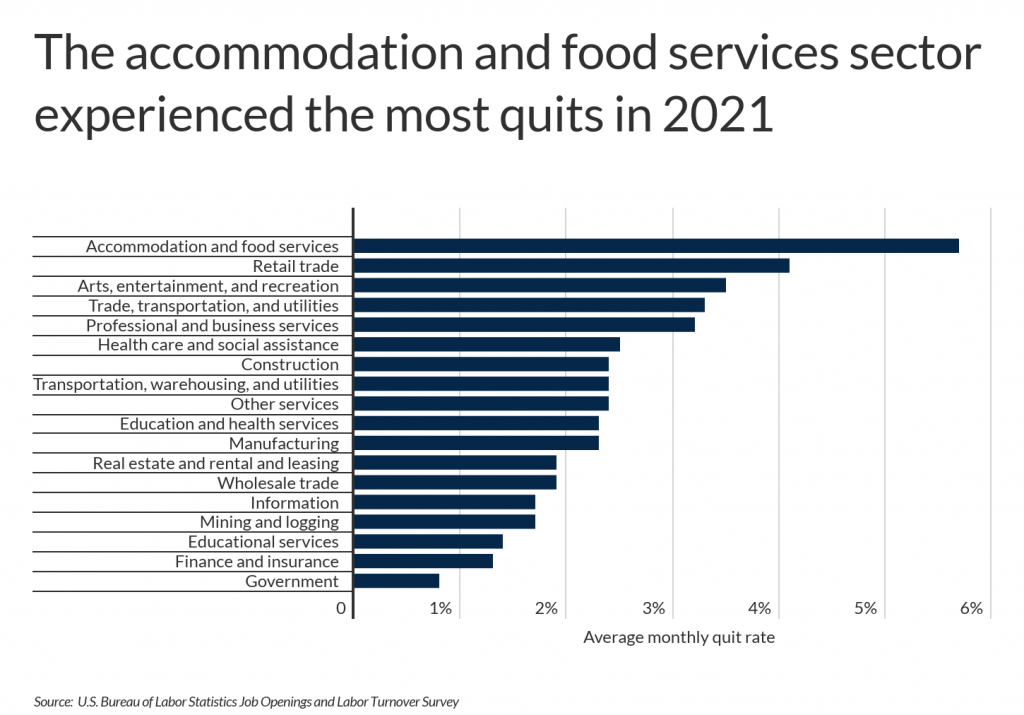
While quits tend to be higher in lower-paying sectors, quits have been rising across nearly every industry. The accommodation and food service industry, which includes restaurants, bars, and hotels, had the highest average monthly quit rate for 2021 at 5.7%. Additionally, the industry had the greatest increase in its quit rate from 2020 to 2021, at 1.5 percentage points. Government had the lowest quit rate in 2021, and is the only sector that saw a decline in its quit rate year over year.
Quit rates vary across the country due to factors such as local job market conditions, cost of living, and local industry makeup. To determine the states with the highest quit rates, researchers at ChamberOfCommerce.org analyzed the latest data from the U.S. Bureau of Labor Statistics. The researchers ranked states according to the average monthly quit rate in 2021. Researchers also calculated the total quits in 2021, the percentage point change in the quit rate from 2020 to 2021, and quits as a percentage of total separations in 2021.
Here are the states with the highest quit rates.
States With the Highest Quit Rates

Photo Credit: f11photo / Shutterstock
15. Michigan
- Average monthly quit rate (2021): 3.0%
- Total quits (2021): 1,250,000
- Percentage point change in quit rate (2020–2021): +0.7
- Quits as a percentage of total separations (2021): 67.9%

Photo Credit: Sean Pavone / Shutterstock
14. Indiana
- Average monthly quit rate (2021): 3.0%
- Total quits (2021): 928,000
- Percentage point change in quit rate (2020–2021): +0.7
- Quits as a percentage of total separations (2021): 70.8%

Photo Credit: f11photo / Shutterstock
13. Louisiana
- Average monthly quit rate (2021): 3.1%
- Total quits (2021): 569,000
- Percentage point change in quit rate (2020–2021): +0.6
- Quits as a percentage of total separations (2021): 69.2%

Photo Credit: Jacob Boomsma / Shutterstock
12. Idaho
- Average monthly quit rate (2021): 3.1%
- Total quits (2021): 244,000
- Percentage point change in quit rate (2020–2021): +0.7
- Quits as a percentage of total separations (2021): 68.7%

Photo Credit: Mary Vanier / Shutterstock
11. Montana
- Average monthly quit rate (2021): 3.1%
- Total quits (2021): 151,000
- Percentage point change in quit rate (2020–2021): +0.7
- Quits as a percentage of total separations (2021): 64.5%

Photo Credit: Sean Pavone / Shutterstock
10. West Virginia
- Average monthly quit rate (2021): 3.1%
- Total quits (2021): 215,000
- Percentage point change in quit rate (2020–2021): +0.6
- Quits as a percentage of total separations (2021): 66.4%

Photo Credit: Sean Pavone / Shutterstock
9. South Carolina
- Average monthly quit rate (2021): 3.1%
- Total quits (2021): 667,000
- Percentage point change in quit rate (2020–2021): +0.5
- Quits as a percentage of total separations (2021): 70.9%

Photo Credit: Jacob Boomsma / Shutterstock
8. Wyoming
- Average monthly quit rate (2021): 3.2%
- Total quits (2021): 86,000
- Percentage point change in quit rate (2020–2021): +0.6
- Quits as a percentage of total separations (2021): 61.9%

Photo Credit: Real Window Creative / Shutterstock
7. North Carolina
- Average monthly quit rate (2021): 3.2%
- Total quits (2021): 1,418,000
- Percentage point change in quit rate (2020–2021): +0.9
- Quits as a percentage of total separations (2021): 66.9%

Photo Credit: Sean Pavone / Shutterstock
6. Mississippi
- Average monthly quit rate (2021): 3.2%
- Total quits (2021): 366,000
- Percentage point change in quit rate (2020–2021): +0.8
- Quits as a percentage of total separations (2021): 68.0%

Photo Credit: Dave H. Fine / Shutterstock
5. Hawaii
- Average monthly quit rate (2021): 3.4%
- Total quits (2021): 191,000
- Percentage point change in quit rate (2020–2021): +0.8
- Quits as a percentage of total separations (2021): 65.4%

Photo Credit: Sean Pavone / Shutterstock
4. Kentucky
- Average monthly quit rate (2021): 3.4%
- Total quits (2021): 636,000
- Percentage point change in quit rate (2020–2021): +0.8
- Quits as a percentage of total separations (2021): 69.1%

Photo Credit: ESB Professional / Shutterstock
3. Georgia
- Average monthly quit rate (2021): 3.5%
- Total quits (2021): 1,598,000
- Percentage point change in quit rate (2020–2021): +1.0
- Quits as a percentage of total separations (2021): 69.2%

Photo Credit: Virrage Images / Shutterstock
2. Nevada
- Average monthly quit rate (2021): 3.8%
- Total quits (2021): 500,000
- Percentage point change in quit rate (2020–2021): +1.0
- Quits as a percentage of total separations (2021): 65.6%

Photo Credit: Marcus Biastock / Shutterstock
1. Alaska
- Average monthly quit rate (2021): 3.8%
- Total quits (2021): 115,000
- Percentage point change in quit rate (2020–2021): +0.9
- Quits as a percentage of total separations (2021): 63.9%
Detailed Findings & Methodology
To determine the states with the highest quit rates, researchers at ChamberOfCommerce.org analyzed the latest data from the U.S. Bureau of Labor Statistics’s Job Openings and Labor Turnover Survey. The researchers ranked states according to the average monthly quit rate from January to October 2021, the latest data available. In the event of a tie, the state with the higher total number of quits from January to October 2021 was ranked higher. Researchers also calculated the percentage point change in the average monthly quit rate from 2020 to 2021 (comparing January to October 2020 to the same months in 2021) and quits as a percentage of total separations in 2021.