Photo Credit: Konstantin L / Shutterstock
The frenzied real estate market over the last two years has been challenging for many homebuyers, but for those who have been able to buy, the return on investment has been strong. Homes are appreciating at a record pace, with sale prices rising around 20% from 2020 to 2021.
With these rapid increases in home values, some investors are looking to rental properties as a source of potential returns. While many of those capitalizing on the current state of the market are institutional investors, the current market conditions could present opportunities for small-scale investors as well. However, these would-be landlords must assess how rapid shifts in the value of real estate could affect their investments in the short and long term.
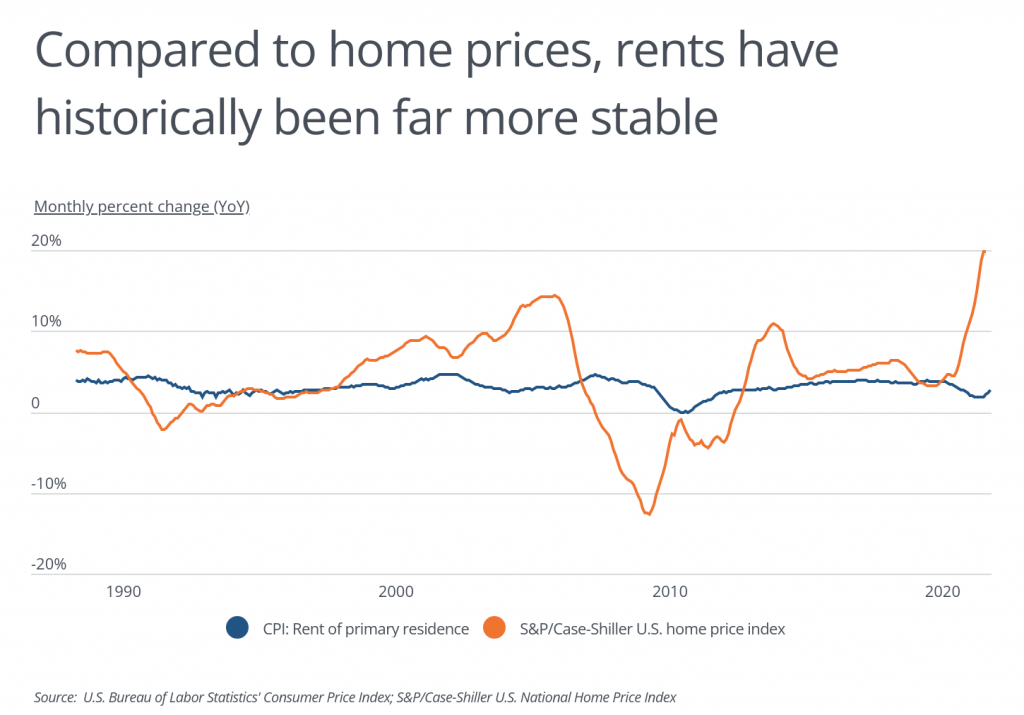
Increasing home prices have been a major story since the pandemic began, but home prices have shown a fair amount of volatility over time, especially in comparison to rent. For example, prices rose at a fairly rapid pace during the real estate bubble of the early to mid-2000s but collapsed when the bubble burst. Home prices then had an uneven recovery until the recent spike beginning in 2020. For rents, meanwhile, the rate of growth year-over-year has held steady between around 2 and 5 percent outside of a dip during the Great Recession and over the last year or so.
The relative stability of rents compared to the current rise in home prices will affect how potential real estate investors assess properties. As sale prices increase, the initial investment and ongoing costs increase as well, which can limit the investment’s cash flow should rents fail to keep pace. On the other hand, rapid appreciation in home values can increase the investor’s overall return when the property is eventually sold.
One example of how home prices can shift an investors’ calculations is the gross rent multiplier, which is a common indicator that investors use to gauge the quality of an investment. Gross rent multiplier is a ratio calculated as the price of a real estate investment divided by the gross annual rental income. Investors usually view a lower ratio as a good investment because it means that the rental income will more quickly recoup the cost of the property. When the investment price rises, the multiplier does as well.
Another example is property taxes. All else being equal, rising home prices translate into larger annual property tax burdens, and thus reduced cash flow. Fortunately, property tax rates vary widely by location, and in many parts of the country, existing owners are paying effective rates of less than 1%.
This collection of factors can help real estate investors hone in on the best locations to make an investment. Markets that have a low gross rent multiplier, low property taxes, and a positive outlook for future property value growth offer the best mix of conditions for a potential investor. In the U.S., most of those locations are found in the South. Southern states tend to have some of the lowest housing prices and lowest property taxes of any region, but the region is also seeing some of the fastest growth in the country, which will boost property values as more people seek housing.
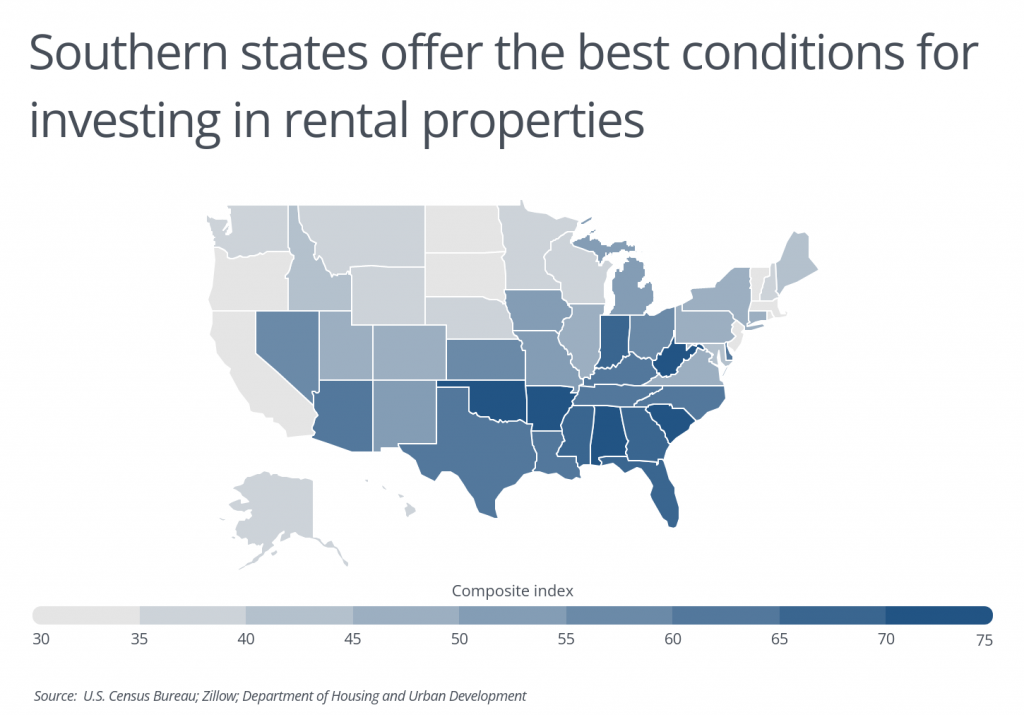
To identify the best locations for buying a rental property, researchers at Stessa created a composite index based on five key factors real estate investors consider when evaluating a market. These factors include the gross rent multiplier, recent and forecasted home price growth, effective property tax rates, and population growth.
Data sources include the U.S. Census Bureau, Zillow, and the Department of Housing and Urban Development. To improve relevance, only locations with at least 100,000 residents and available data from all sources were included in the analysis.
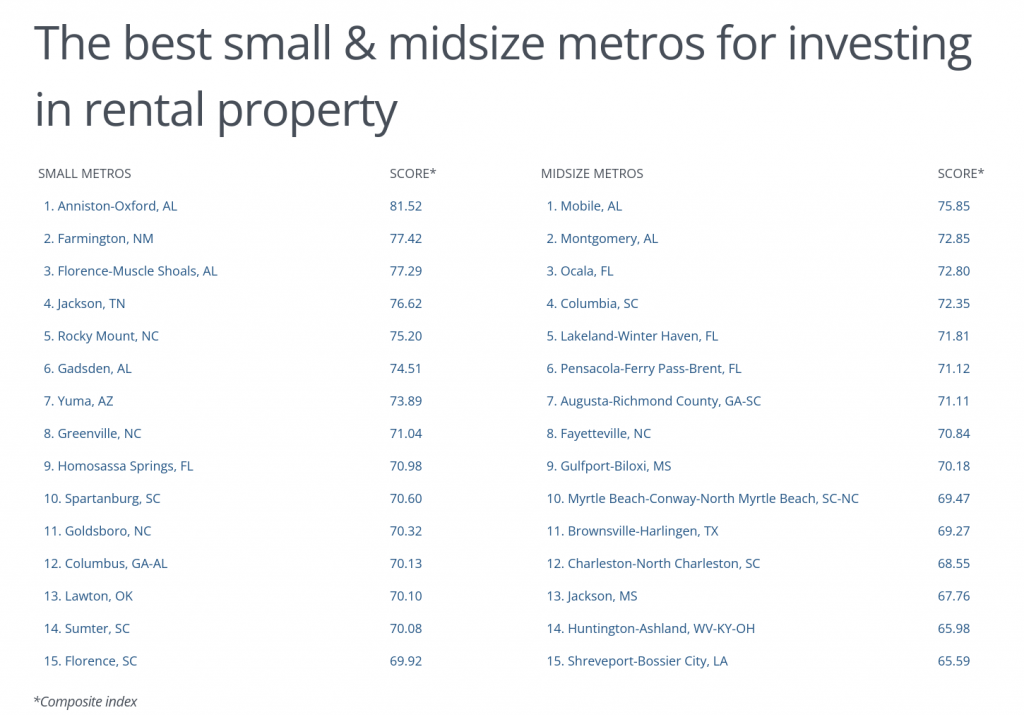
Here are the best U.S. metropolitan areas to invest in a rental property.
The Best Large Metros for Investing in Rental Property

Photo Credit: Mihai_Andritoiu / Shutterstock
15. Nashville-Davidson–Murfreesboro–Franklin, TN
- Composite index: 53.27
- Gross rent multiplier: 21.4
- Median monthly rent: $1,422
- Median home price: $365,573
- Year-over-year change in home price: +20.9%
- Forecasted home price growth: +19.0%
- Effective property tax rate: 0.56%
- Year-over-year change in population: +1.4%

Photo Credit: Sean Pavone / Shutterstock
14. Miami-Fort Lauderdale-Pompano Beach, FL
- Composite index: 53.81
- Gross rent multiplier: 17.4
- Median monthly rent: $1,798
- Median home price: $375,082
- Year-over-year change in home price: +18.2%
- Forecasted home price growth: +20.6%
- Effective property tax rate: 0.92%
- Year-over-year change in population: +0.1%

Photo Credit: Jon Bilous / Shutterstock
13. Charlotte-Concord-Gastonia, NC-SC
- Composite index: 54.74
- Gross rent multiplier: 20.3
- Median monthly rent: $1,306
- Median home price: $317,876
- Year-over-year change in home price: +23.8%
- Forecasted home price growth: +23.0%
- Effective property tax rate: 0.77%
- Year-over-year change in population: +1.7%

Photo Credit: Virrage Images / Shutterstock
12. Las Vegas-Henderson-Paradise, NV
- Composite index: 55.19
- Gross rent multiplier: 21.2
- Median monthly rent: $1,488
- Median home price: $378,476
- Year-over-year change in home price: +24.1%
- Forecasted home price growth: +18.5%
- Effective property tax rate: 0.58%
- Year-over-year change in population: +1.8%

Photo Credit: f11photo / Shutterstock
11. San Antonio-New Braunfels, TX
- Composite index: 55.41
- Gross rent multiplier: 16.6
- Median monthly rent: $1,308
- Median home price: $260,466
- Year-over-year change in home price: +19.3%
- Forecasted home price growth: +17.6%
- Effective property tax rate: 1.62%
- Year-over-year change in population: +1.6%

Photo Credit: Sean Pavone / Shutterstock
10. Houston-The Woodlands-Sugar Land, TX
- Composite index: 55.76
- Gross rent multiplier: 15.8
- Median monthly rent: $1,410
- Median home price: $267,794
- Year-over-year change in home price: +17.9%
- Forecasted home price growth: +15.5%
- Effective property tax rate: 1.67%
- Year-over-year change in population: +1.3%

Photo Credit: Sean Pavone / Shutterstock
9. Oklahoma City, OK
- Composite index: 57.21
- Gross rent multiplier: 15.0
- Median monthly rent: $1,056
- Median home price: $190,559
- Year-over-year change in home price: +13.7%
- Forecasted home price growth: +11.9%
- Effective property tax rate: 0.93%
- Year-over-year change in population: +1.1%

Photo Credit: Sean Pavone / Shutterstock
8. Phoenix-Mesa-Chandler, AZ
- Composite index: 57.45
- Gross rent multiplier: 21.7
- Median monthly rent: $1,572
- Median home price: $410,028
- Year-over-year change in home price: +32.2%
- Forecasted home price growth: +23.8%
- Effective property tax rate: 0.57%
- Year-over-year change in population: +2.1%

Photo Credit: Sean Pavone / Shutterstock
7. Memphis, TN-MS-AR
- Composite index: 59.35
- Gross rent multiplier: 15.3
- Median monthly rent: $1,077
- Median home price: $198,369
- Year-over-year change in home price: +17.7%
- Forecasted home price growth: +16.4%
- Effective property tax rate: 1.01%
- Year-over-year change in population: +0.2%

Photo Credit: Sean Pavone / Shutterstock
6. Tulsa, OK
- Composite index: 59.55
- Gross rent multiplier: 14.8
- Median monthly rent: $1,028
- Median home price: $181,919
- Year-over-year change in home price: +14.5%
- Forecasted home price growth: +14.1%
- Effective property tax rate: 0.95%
- Year-over-year change in population: +0.7%

Photo Credit: GagliardiPhotography / Shutterstock
5. Jacksonville, FL
- Composite index: 61.17
- Gross rent multiplier: 17.7
- Median monthly rent: $1,418
- Median home price: $301,415
- Year-over-year change in home price: +23.5%
- Forecasted home price growth: +23.8%
- Effective property tax rate: 0.90%
- Year-over-year change in population: +1.7%

Photo Credit: Sean Pavone / Shutterstock
4. Atlanta-Sandy Springs-Alpharetta, GA
- Composite index: 61.70
- Gross rent multiplier: 17.4
- Median monthly rent: $1,506
- Median home price: $315,033
- Year-over-year change in home price: +23.0%
- Forecasted home price growth: +23.9%
- Effective property tax rate: 0.88%
- Year-over-year change in population: +1.0%

Photo Credit: Sean Pavone / Shutterstock
3. Birmingham-Hoover, AL
- Composite index: 62.03
- Gross rent multiplier: 15.9
- Median monthly rent: $1,100
- Median home price: $210,425
- Year-over-year change in home price: +15.3%
- Forecasted home price growth: +13.2%
- Effective property tax rate: 0.49%
- Year-over-year change in population: +0.1%

Photo Credit: Sean Pavone / Shutterstock
2. Orlando-Kissimmee-Sanford, FL
- Composite index: 63.00
- Gross rent multiplier: 16.0
- Median monthly rent: $1,678
- Median home price: $321,666
- Year-over-year change in home price: +18.7%
- Forecasted home price growth: +15.8%
- Effective property tax rate: 0.86%
- Year-over-year change in population: +1.2%

Photo Credit: Sean Pavone / Shutterstock
1. Tampa-St. Petersburg-Clearwater, FL
- Composite index: 65.26
- Gross rent multiplier: 17.0
- Median monthly rent: $1,523
- Median home price: $310,378
- Year-over-year change in home price: +27.7%
- Forecasted home price growth: +27.2%
- Effective property tax rate: 0.90%
- Year-over-year change in population: +1.4%
Methodology & Detailed Findings
To identify the best locations for buying a rental property, researchers created a composite index based on the following factors:
- Gross rent multiplier (50%) – The ratio of a location’s median home price to its annual gross rent. For a real estate investor, a lower gross rent multiplier represents a better opportunity.
- Year-over-year change in home price (10%) – The percentage change in the median home price between September 2020 and September 2021.
- Forecasted home price growth (10%) – The forecasted one-year change in home price from September 2021 to September 2022.
- Effective property tax rate (20%) – An estimate of the location’s property tax burden by dividing total property taxes paid in 2019 by the aggregate value of those properties. A lower value is better for investors.
- Year-over-year change in population (10%) – The percentage change in population between 2019 and 2020.
Data sources include: U.S. Census Bureau’s 2019 American Community Survey and Population Estimates; Zillow’s Price Forecasts and Zillow Home Value Index; Department of Housing and Urban Development’s 50th Percentile Rent Estimates. To improve relevance, only locations with at least 100,000 residents and available data from all sources were included in the analysis. Additionally, metropolitan areas were grouped into cohorts based on population: small (100,000–349,999), midsize (350,000–999,999), and large (1,000,000 or more).