
Photo Credit: Monkey Business Images / Shutterstock
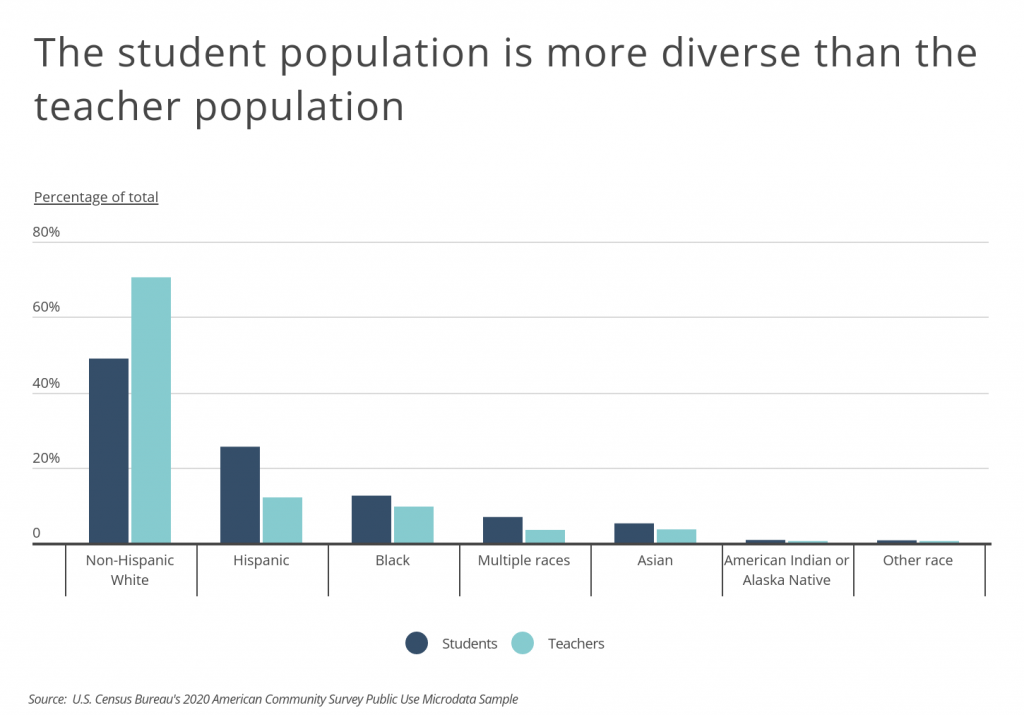
As the American population becomes more diverse, so does the population of school-aged children. However, teacher diversity is not keeping up, and the diversity gap between students and teachers continues to widen. According to 2020 data from the U.S. Census Bureau, 51% of students are not white. In comparison, non-white teachers account for less than 30% of teachers nationally.
The teacher diversity gap—the percentage point difference between the share of students that are non-white and the share of teachers that are non-white—is nearly 22 percentage points. For example, 12.5% of students in the U.S. are black, but only 9.6% of teachers are. The gap between Hispanic students and teachers is even wider, with the proportion of Hispanic students (25.5%) more than double that of Hispanic teachers (12.0%).
Minority teachers can benefit minority students in multiple ways. Research shows that minority students do better in school when they have at least one teacher of the same race. Minority teachers not only act as role models for minority students, but they also have higher expectations for minority students. Additionally, minority teachers are likely to have a better cultural understanding of minority students, which experts argue can be beneficial in more effectively connecting and forming relationships with students.
According to research from the Urban Institute, the diversity gap between students and teachers is not because people of color are less likely to choose to become teachers. Instead, it stems from young minority adults being less likely to attend and graduate from college. While a similar share of Hispanics, blacks, and white college graduates go on to become teachers, whites are over twice as likely to be college graduates as blacks or Hispanics. Teacher diversity is restricted due to the still relatively small pool of diverse college graduates.
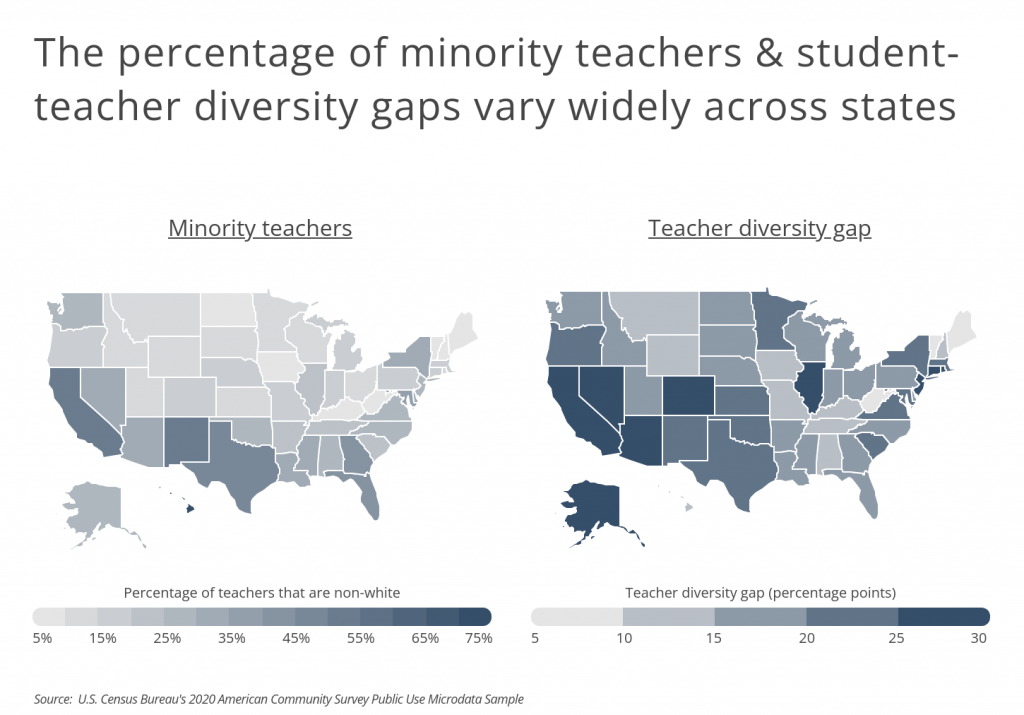
On a geographic basis, the share of minority teachers and students varies depending on local demographics. That said, there is not a strong correlation between the share of non-white teachers and the teacher diversity gap. For example, the Southwest has the greatest share of non-white teachers and also large diversity gaps. The Great Plains, Midwest, and New England states generally report lower proportions of non-white teachers, but diversity gaps vary widely.
At the state level, Hawaii boasts the highest share of non-white teachers at nearly 75%. The student population in Hawaii is even more diverse with non-white students accounting for 89% of all students. On the other hand, North Dakota has the lowest share of non-white teachers at just 3.6%.
To find the metropolitan areas with the most minority teachers, researchers at Smartest Dollar analyzed the latest data from the U.S. Census Bureau. The researchers ranked metros according to the percentage of teachers that are non-white. Researchers also calculated the percentage of students that are non-white, the teacher diversity gap, and the total number of non-white students and teachers. Only the 100 most populous metro areas were included in the analysis.
Large Metros With the Most Minority Teachers
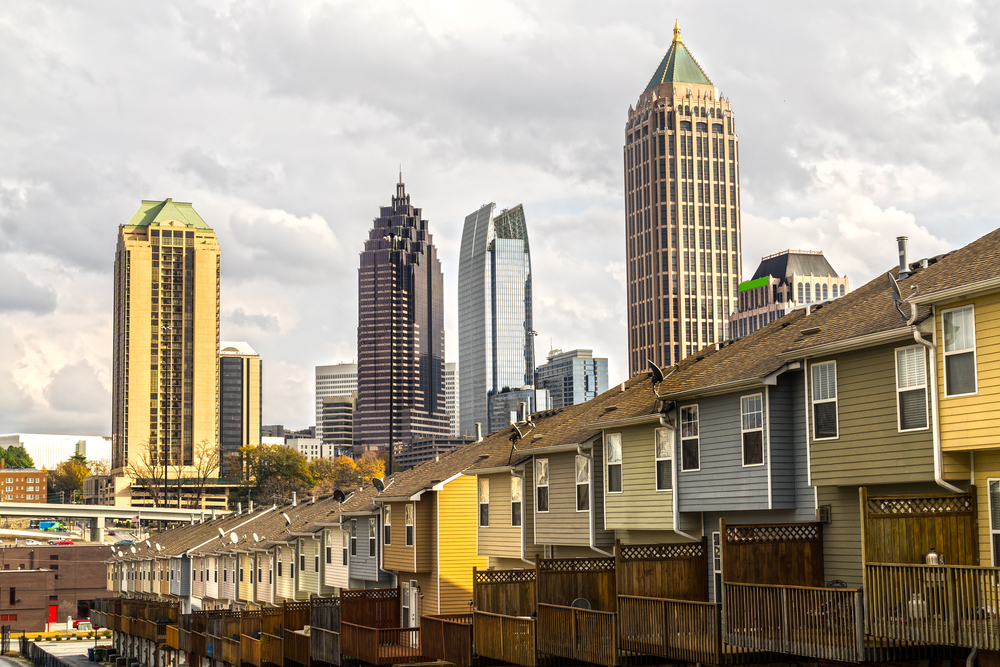
Photo Credit: Luciano Mortula – LGM / Shutterstock
15. Atlanta-Sandy Springs-Roswell, GA
- Percentage of teachers that are non-white: 48.6%
- Percentage of students that are non-white: 63.4%
- Teacher diversity gap (percentage points): 14.9
- Total non-white teachers: 60,355
- Total non-white students: 670,570
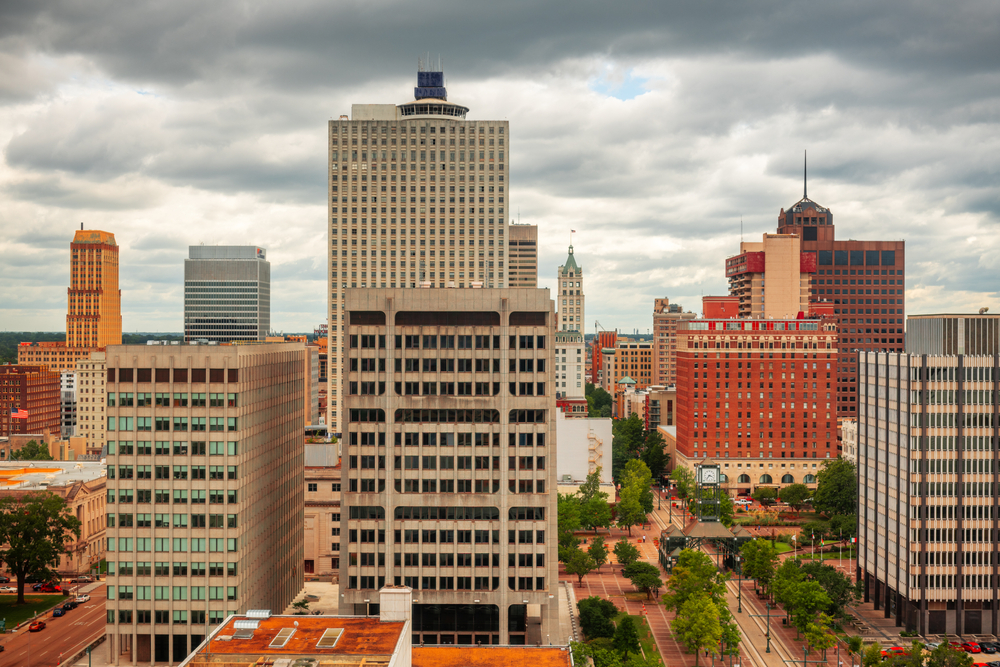
Photo Credit: Sean Pavone / Shutterstock
14. Memphis, TN-MS-AR
- Percentage of teachers that are non-white: 50.6%
- Percentage of students that are non-white: 64.5%
- Teacher diversity gap (percentage points): 13.9
- Total non-white teachers: 11,527
- Total non-white students: 129,208
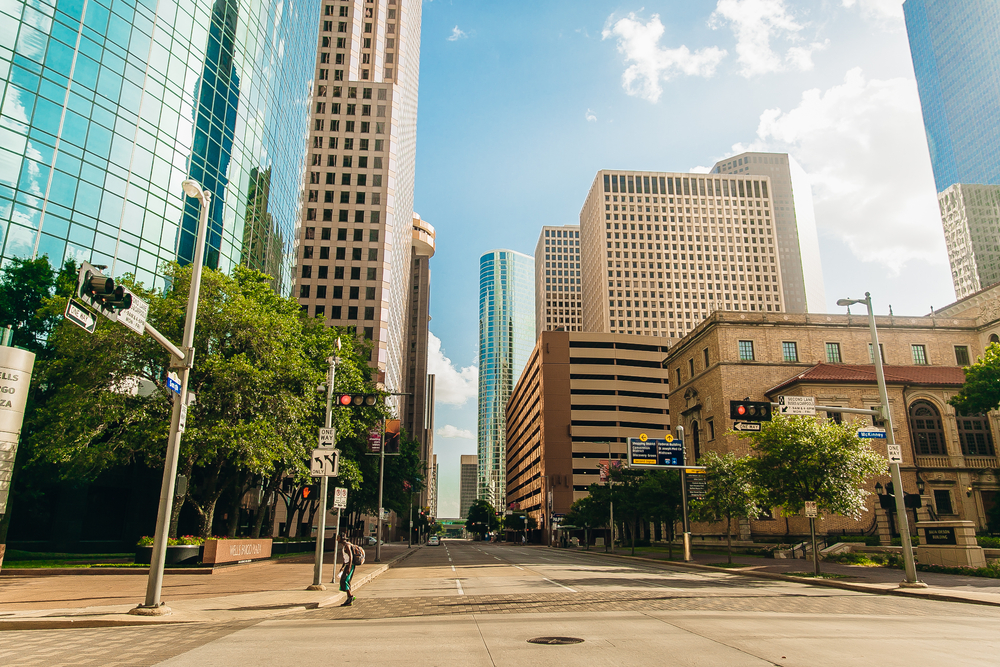
Photo Credit: Tomas Simkus / Shutterstock
13. Houston-The Woodlands-Sugar Land, TX
- Percentage of teachers that are non-white: 50.8%
- Percentage of students that are non-white: 74.9%
- Teacher diversity gap (percentage points): 24.2
- Total non-white teachers: 69,067
- Total non-white students: 955,410
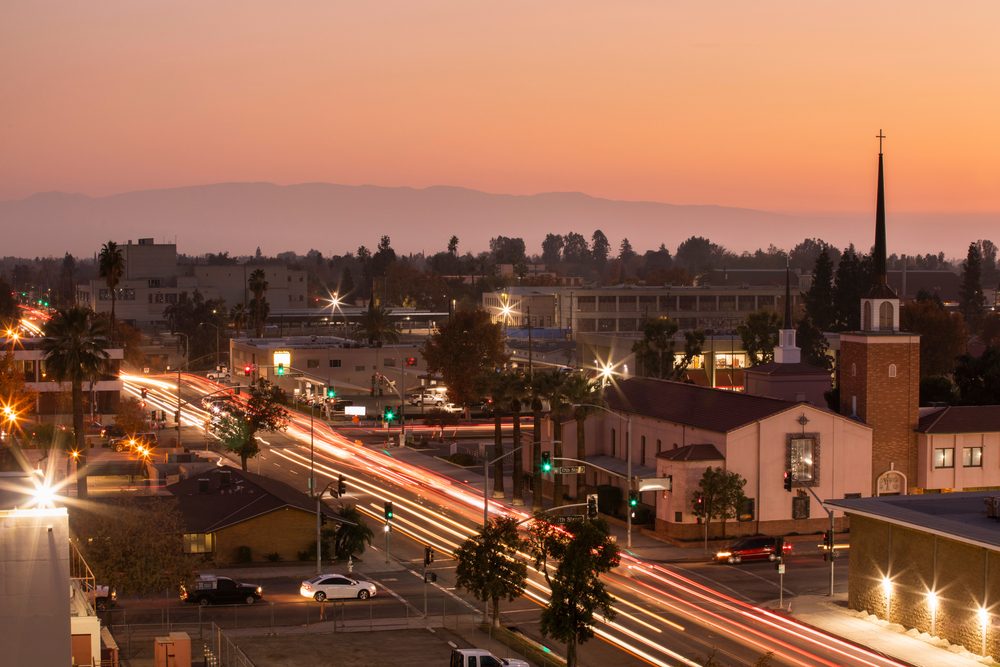
Photo Credit: Matt Gush / Shutterstock
12. Bakersfield, CA
- Percentage of teachers that are non-white: 51.9%
- Percentage of students that are non-white: 81.6%
- Teacher diversity gap (percentage points): 29.8
- Total non-white teachers: 7,539
- Total non-white students: 147,204
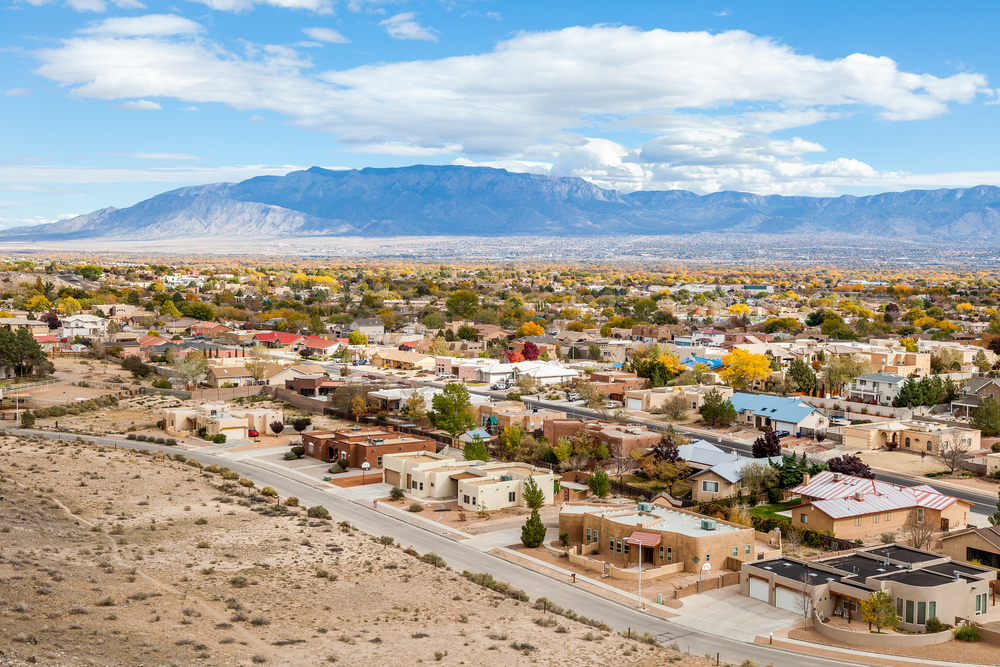
Photo Credit: turtix / Shutterstock
11. Albuquerque, NM
- Percentage of teachers that are non-white: 52.0%
- Percentage of students that are non-white: 75.5%
- Teacher diversity gap (percentage points): 23.5
- Total non-white teachers: 8,443
- Total non-white students: 101,708
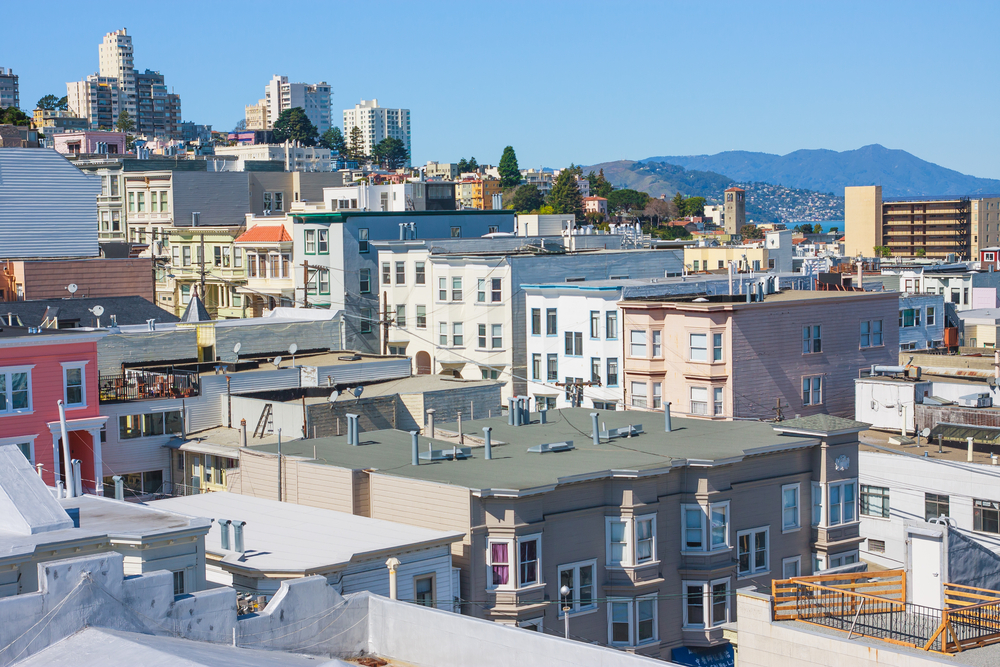
Photo Credit: Radoslaw Lecyk / Shutterstock
10. San Francisco-Oakland-Hayward, CA
- Percentage of teachers that are non-white: 53.1%
- Percentage of students that are non-white: 72.2%
- Teacher diversity gap (percentage points): 19.1
- Total non-white teachers: 48,623
- Total non-white students: 490,634
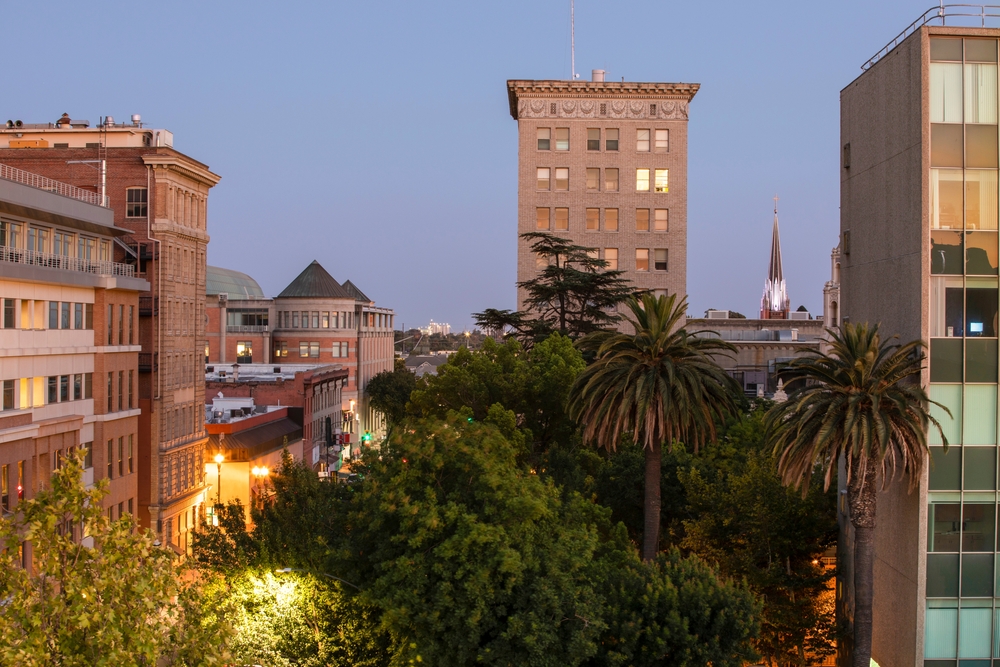
Photo Credit: Matt Gush / Shutterstock
9. Stockton-Lodi, CA
- Percentage of teachers that are non-white: 53.4%
- Percentage of students that are non-white: 83.3%
- Teacher diversity gap (percentage points): 29.9
- Total non-white teachers: 5,785
- Total non-white students: 125,587
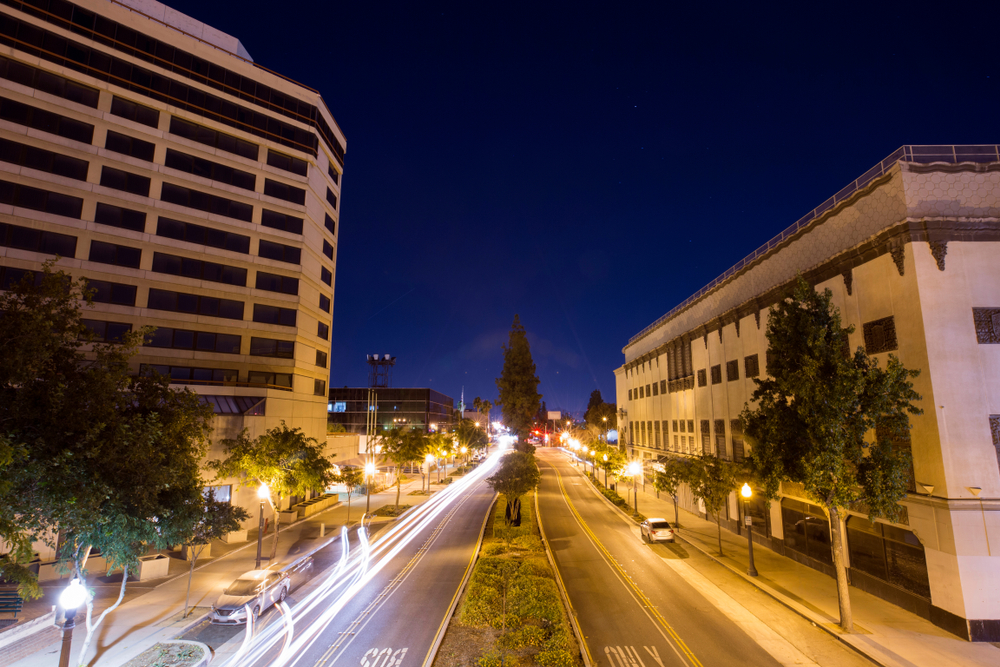
Photo Credit: Matt Gush / Shutterstock
8. Riverside-San Bernardino-Ontario, CA
- Percentage of teachers that are non-white: 55.3%
- Percentage of students that are non-white: 82.1%
- Teacher diversity gap (percentage points): 26.8
- Total non-white teachers: 35,096
- Total non-white students: 690,707
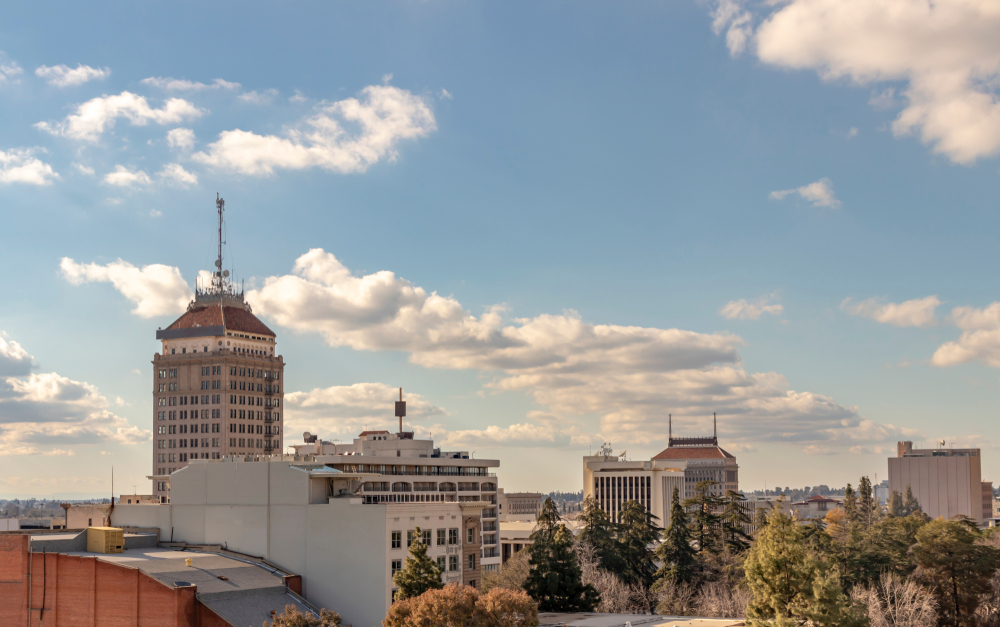
Photo Credit: stellamc / Shutterstock
7. Fresno, CA
- Percentage of teachers that are non-white: 57.5%
- Percentage of students that are non-white: 83.5%
- Teacher diversity gap (percentage points): 26.0
- Total non-white teachers: 10,273
- Total non-white students: 170,247
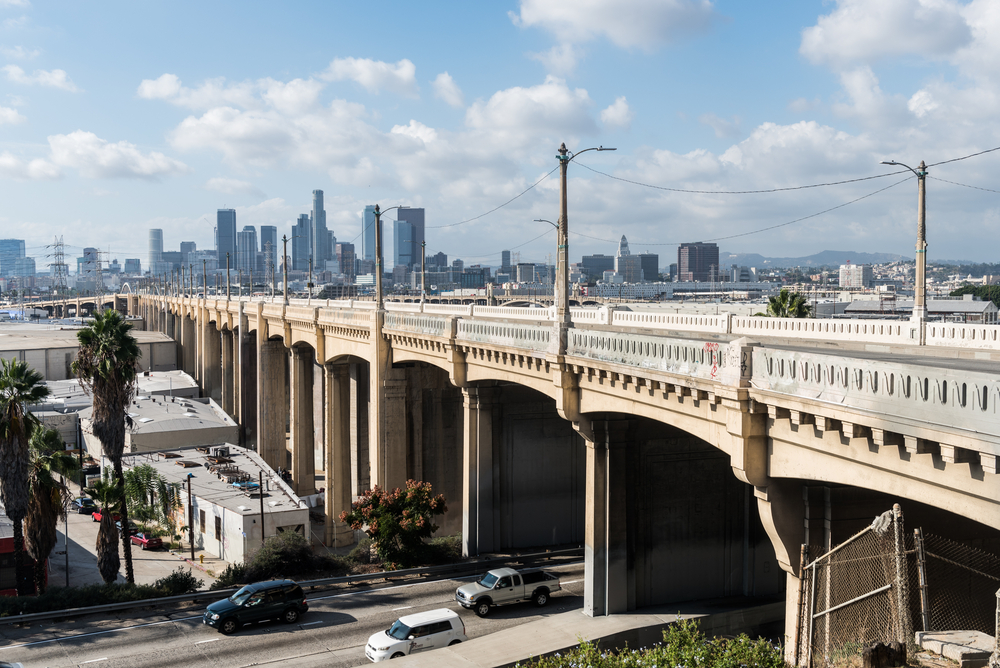
Photo Credit: Hayk Shalunts / Shutterstock
6. Los Angeles-Long Beach-Anaheim, CA
- Percentage of teachers that are non-white: 60.0%
- Percentage of students that are non-white: 81.8%
- Teacher diversity gap (percentage points): 21.8
- Total non-white teachers: 128,026
- Total non-white students: 1,679,356
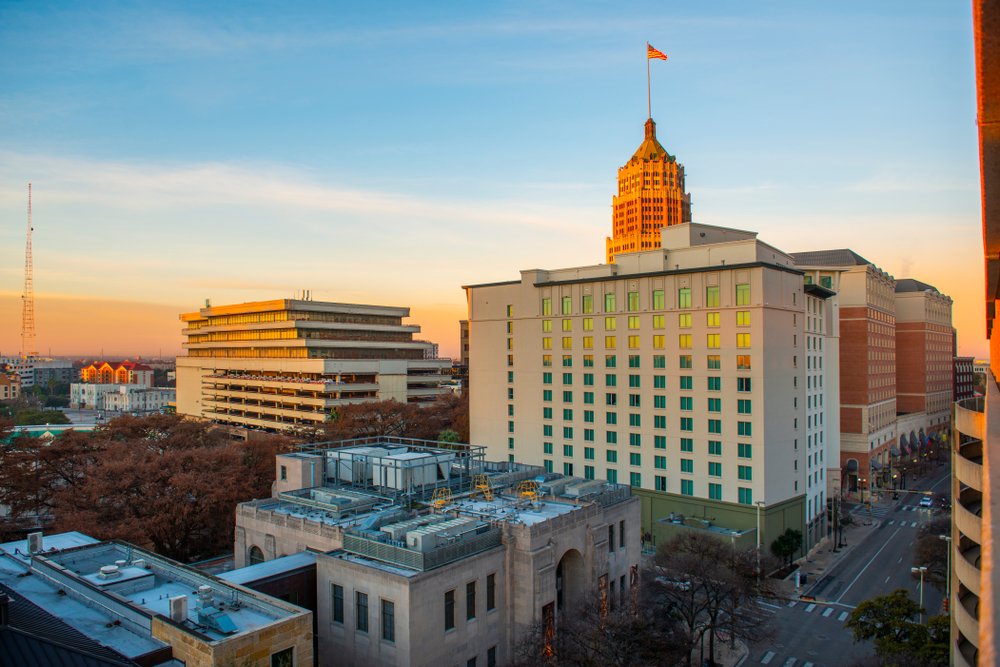
Photo Credit: Wangkun Jia / Shutterstock
5. San Antonio-New Braunfels, TX
- Percentage of teachers that are non-white: 61.1%
- Percentage of students that are non-white: 79.6%
- Teacher diversity gap (percentage points): 18.5
- Total non-white teachers: 28,707
- Total non-white students: 384,196
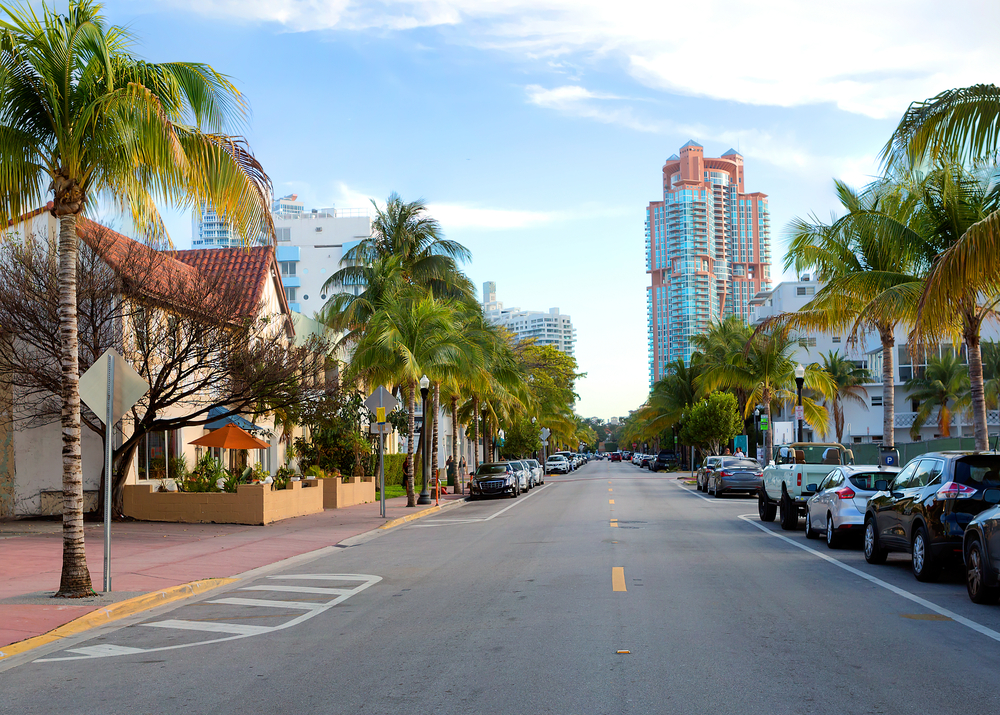
Photo Credit: Galina Savina / Shutterstock
4. Miami-Fort Lauderdale-West Palm Beach, FL
- Percentage of teachers that are non-white: 65.1%
- Percentage of students that are non-white: 78.5%
- Teacher diversity gap (percentage points): 13.4
- Total non-white teachers: 74,134
- Total non-white students: 705,013
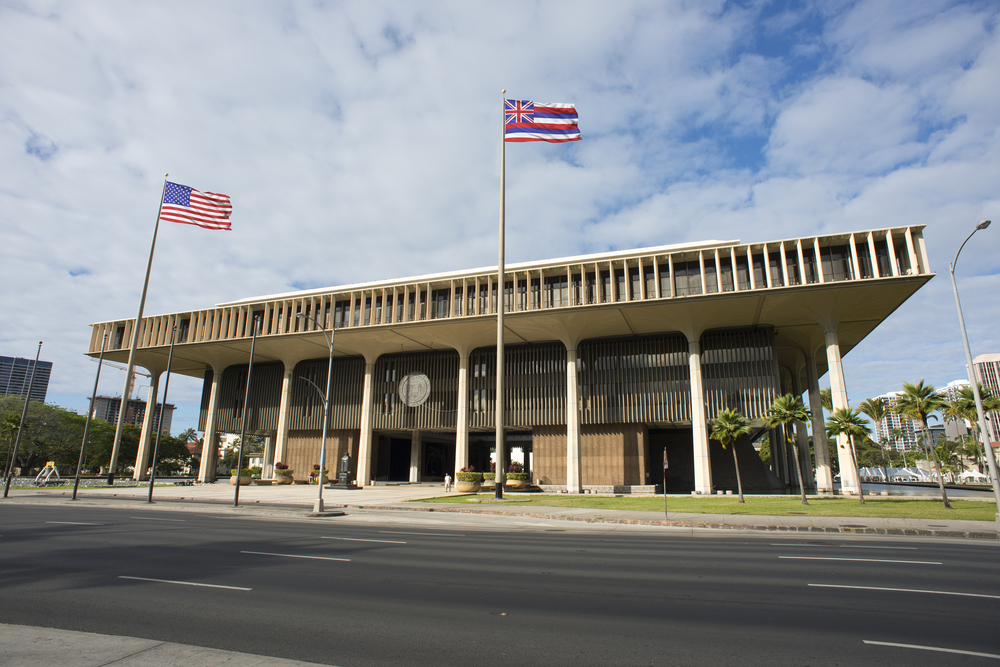
Photo Credit: W. Scott McGill / Shutterstock
3. Urban Honolulu, HI
- Percentage of teachers that are non-white: 78.2%
- Percentage of students that are non-white: 89.3%
- Teacher diversity gap (percentage points): 11.2
- Total non-white teachers: 17,735
- Total non-white students: 116,498
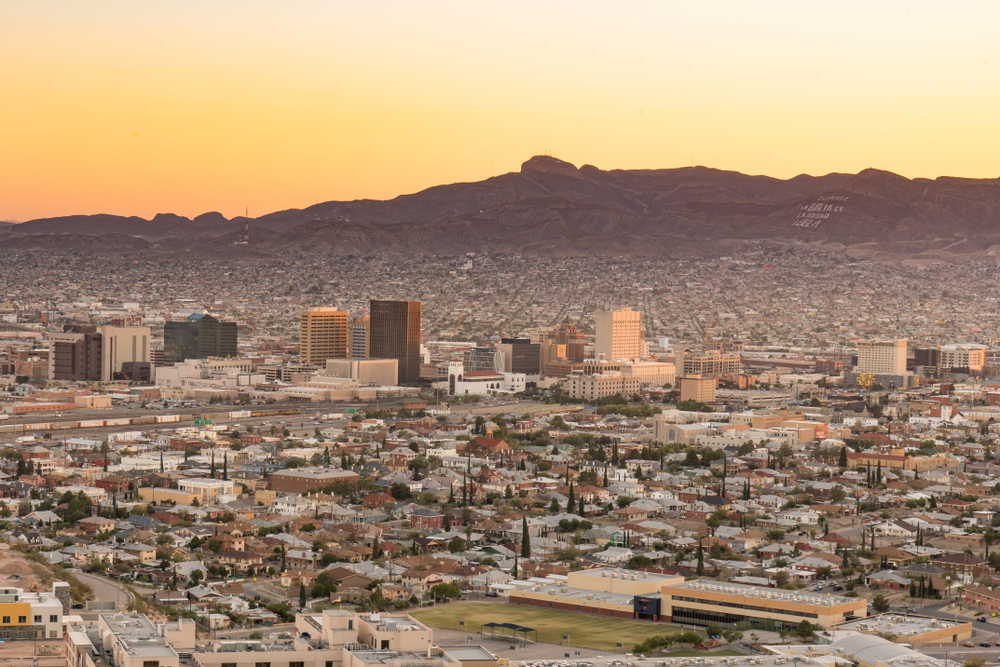
Photo Credit: Paul Brady Photography / Shutterstock
2. El Paso, TX
- Percentage of teachers that are non-white: 81.9%
- Percentage of students that are non-white: 95.5%
- Teacher diversity gap (percentage points): 13.7
- Total non-white teachers: 15,784
- Total non-white students: 147,364
Photo Credit: D Guest Smith / Shutterstock
1. McAllen-Edinburg-Mission, TX
- Percentage of teachers that are non-white: 95.7%
- Percentage of students that are non-white: 97.6%
- Teacher diversity gap (percentage points): 1.9
- Total non-white teachers: 17,638
- Total non-white students: 198,157
Detailed Findings & Methodology
To find the metropolitan areas with the most minority teachers, researchers at Self analyzed data from the U.S. Census Bureau’s 2020 American Community Survey Public Use Microdata Sample. The researchers ranked metros according to the percentage of teachers that are non-white. In the event of a tie, the metro with the larger total number of non-white teachers was ranked higher. Researchers also calculated the percentage of students that are non-white, the teacher diversity gap (percentage point difference in the percentage of students that are non-white and the percentage of teachers that are non-white), and the total number of non-white students and teachers. Only the 100 most populous metro areas were included in the analysis.