
Photo Credit: Photographee.eu / Shutterstock
Despite the challenges that COVID-19 created for the U.S. economy over the last two years, recent months have shown major signs of positive economic news. For one, the U.S. Bureau of Economic Analysis estimated that GDP increased by 7% in the last quarter of 2021, an impressive figure even during another spike in COVID cases at the end of last year. And while inflation has been a significant pressure on many households’ finances, workers in almost every industry have seen wage growth since COVID-19 began.
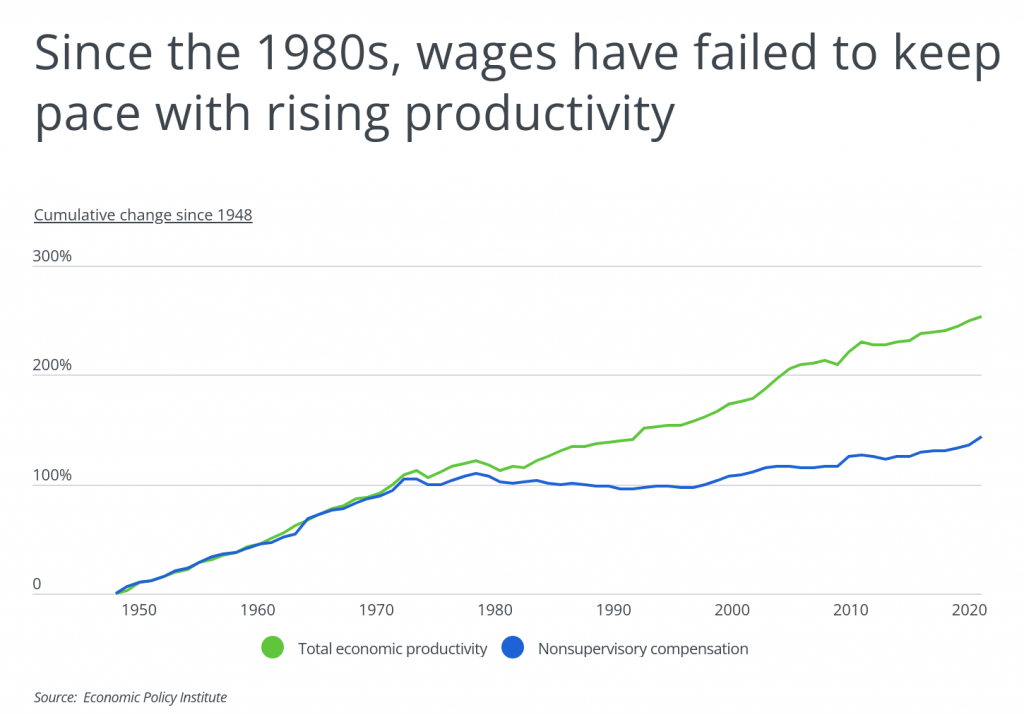
The simultaneous increases in economic productivity and wages are particularly noteworthy because of the increasing gap between the two in recent years. From 1948 to around 1980, total economic productivity and worker compensation for non-supervisory positions grew at roughly the same pace: over that span, economic productivity increased by 113% and compensation grew by 102%. Since the beginning of the 1980s, economic productivity has continued to grow steadily, but wage growth has not kept up. From 1980 to 2000, real wages were almost completely stagnant, and while compensation has increased more since 2000, the rate of wage growth lags behind the rate for productivity. In 2020, economic productivity had seen a cumulative 253% increase since 1948, while real wages were up only 144% over that span.
A significant portion of the gap between productivity growth and wage growth can be attributed to advances in computing, automation, and other technologies in recent decades. While these advances have provided many benefits to the economy, the gap between productivity and wage growth is closely related to rising levels of economic inequality in the U.S. Rapidly growing industries have seen more proportional wage increases, even as other fields continue to stagnate, so workers in more productive fields are significantly better off. And in many cases, economic productivity that is not translated into increased compensation is likely to be retained by a business’s executives or shareholders.
These disparities also emerge according to geography. Certain locations have clusters of businesses in fields with high growth in productivity, such as finance and banking in the New York City metro or tech in Silicon Valley. As businesses and industries in these locations continue to grow, their success provides the conditions and resources to continue growing, expanding, or founding businesses and attract more human capital, which concentrates even more productivity growth in a limited number of locations.
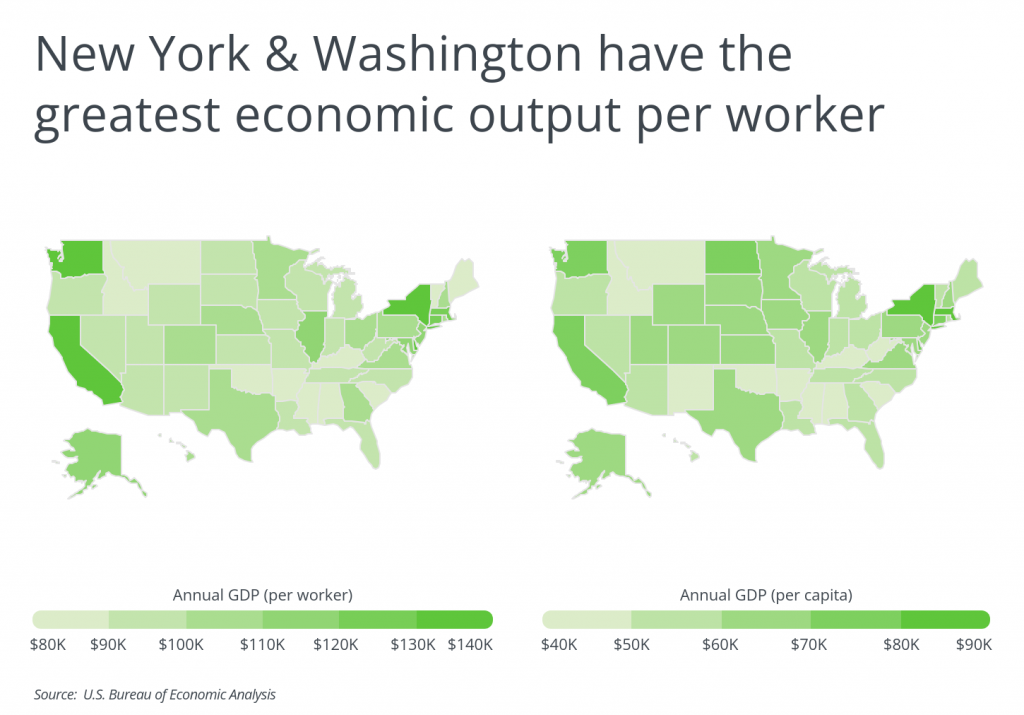
Many coastal states are the leaders in economic productivity on a per capita or per worker basis. The state with the highest annual GDP both per worker and per capita is New York, which houses many of America’s largest banks and financial firms. Other high-ranking states include Washington, which is home to tech giants Amazon and Microsoft; Massachusetts, which has a strong biotechnology sector and many finance and insurance firms; and California, which hosts many of the largest and fastest-growing tech companies in Silicon Valley. At the metro level, the major cities in these states like New York, Seattle, Boston, San Jose, and San Francisco are at the top of the list for economic productivity.
The data used in this study is from the U.S. Bureau of Economic Analysis. To determine the locations with the most productive economies, researchers at HireAHelper calculated the total annual gross domestic product (GDP) per worker. In the event of a tie, the location with the greater per capita GDP was ranked higher. All statistics are from 2020, the most recent year available.
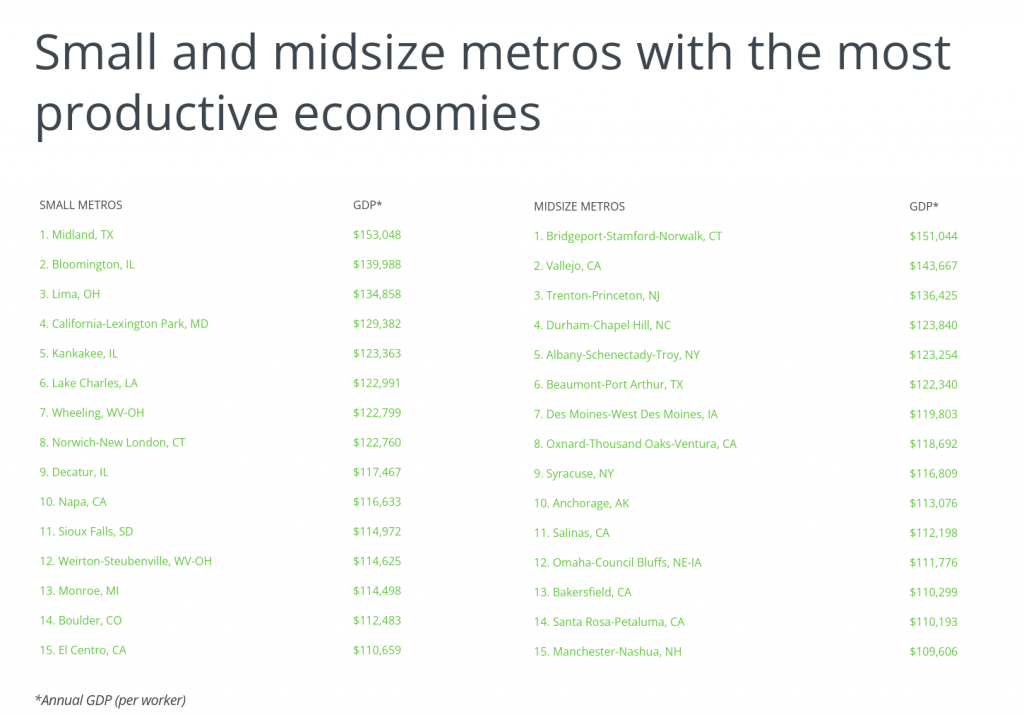
Here are the metropolitan areas with the most productive economies.
Large Metros With the Most Productive Economies

Photo Credit: Sean Pavone / Shutterstock
15. Charlotte-Concord-Gastonia, NC-SC
- Annual GDP (per worker): $114,019
- Annual GDP (per capita): $68,852
- Annual GDP (total): $184,819,000,000
- Total employment: 1,620,954
- Total population: 2,684,276

Photo Credit: aceshot1 / Shutterstock
14. Cincinnati, OH-KY-IN
- Annual GDP (per worker): $114,580
- Annual GDP (per capita): $68,350
- Annual GDP (total): $152,619,000,000
- Total employment: 1,331,990
- Total population: 2,232,907

Photo Credit: f11photo / Shutterstock
13. Baltimore-Columbia-Towson, MD
- Annual GDP (per worker): $116,919
- Annual GDP (per capita): $73,499
- Annual GDP (total): $205,811,000,000
- Total employment: 1,760,280
- Total population: 2,800,189

Photo Credit: RaulCano / Shutterstock
12. Houston-The Woodlands-Sugar Land, TX
- Annual GDP (per worker): $117,010
- Annual GDP (per capita): $68,232
- Annual GDP (total): $488,165,000,000
- Total employment: 4,172,005
- Total population: 7,154,478

Photo Credit: Sean Pavone / Shutterstock
11. San Diego-Chula Vista-Carlsbad, CA
- Annual GDP (per worker): $118,796
- Annual GDP (per capita): $72,143
- Annual GDP (total): $240,411,000,000
- Total employment: 2,023,738
- Total population: 3,332,427

Photo Credit: Sean Pavone / Shutterstock
10. Chicago-Naperville-Elgin, IL-IN-WI
- Annual GDP (per worker): $120,473
- Annual GDP (per capita): $73,670
- Annual GDP (total): $692,988,000,000
- Total employment: 5,752,239
- Total population: 9,406,638

Photo Credit: Sean Pavone / Shutterstock
9. Philadelphia-Camden-Wilmington, PA-NJ-DE-MD
- Annual GDP (per worker): $121,012
- Annual GDP (per capita): $71,883
- Annual GDP (total): $439,055,000,000
- Total employment: 3,628,203
- Total population: 6,107,906

Photo Credit: Sean Pavone / Shutterstock
8. Los Angeles-Long Beach-Anaheim, CA
- Annual GDP (per worker): $122,311
- Annual GDP (per capita): $76,815
- Annual GDP (total): $1,007,040,000,000
- Total employment: 8,233,468
- Total population: 13,109,903

Photo Credit: Sean Pavone / Shutterstock
7. Hartford-East Hartford-Middletown, CT
- Annual GDP (per worker): $128,108
- Annual GDP (per capita): $82,657
- Annual GDP (total): $99,311,154,000
- Total employment: 775,213
- Total population: 1,201,483

Photo Credit: ESB Professional / Shutterstock
6. Washington-Arlington-Alexandria, DC-VA-MD-WV
- Annual GDP (per worker): $132,624
- Annual GDP (per capita): $88,705
- Annual GDP (total): $561,028,000,000
- Total employment: 4,230,210
- Total population: 6,324,629

Photo Credit: Travellaggio / Shutterstock
5. Boston-Cambridge-Newton, MA-NH
- Annual GDP (per worker): $139,642
- Annual GDP (per capita): $98,460
- Annual GDP (total): $480,307,000,000
- Total employment: 3,439,563
- Total population: 4,878,211

Photo Credit: dibrova / Shutterstock
4. New York-Newark-Jersey City, NY-NJ-PA
- Annual GDP (per worker): $152,833
- Annual GDP (per capita): $94,608
- Annual GDP (total): $1,809,320,000,000
- Total employment: 11,838,530
- Total population: 19,124,359

Photo Credit: mahaloshine / Shutterstock
3. Seattle-Tacoma-Bellevue, WA
- Annual GDP (per worker): $165,963
- Annual GDP (per capita): $106,241
- Annual GDP (total): $426,940,000,000
- Total employment: 2,572,508
- Total population: 4,018,598

Photo Credit: Bogdan Vacarciuc / Shutterstock
2. San Francisco-Oakland-Berkeley, CA
- Annual GDP (per worker): $185,637
- Annual GDP (per capita): $125,260
- Annual GDP (total): $588,336,000,000
- Total employment: 3,169,280
- Total population: 4,696,902

Photo Credit: Uladzik Kryhin / Shutterstock
1. San Jose-Sunnyvale-Santa Clara, CA
- Annual GDP (per worker): $259,532
- Annual GDP (per capita): $182,893
- Annual GDP (total): $360,511,000,000
- Total employment: 1,389,082
- Total population: 1,971,160
Methodology & Detailed Findings
The data used in this study is from the U.S. Bureau of Economic Analysis. To determine the locations with the most productive economies, researchers calculated the total annual gross domestic product (GDP) per worker. In the event of a tie, the location with the greater per capita GDP was ranked higher. All statistics are from 2020, the most recent year available. Only locations with at least 100,000 residents were included. To improve relevance, metropolitan areas were grouped into population cohorts: small (100,000–349,999), midsize (350,000–999,999), and large (1,000,000+).