
Photo Credit: spyarm / Shutterstock
With a foreign-born population of more than 44 million, the U.S. has the largest number of immigrants in the world. In fact, research from the Pew Research Center shows that the U.S. immigrant population accounts for one-fifth of the world’s migrants. While U.S. immigrants come from almost every country in the world, Mexico is the most common country of origin for the foreign-born population.
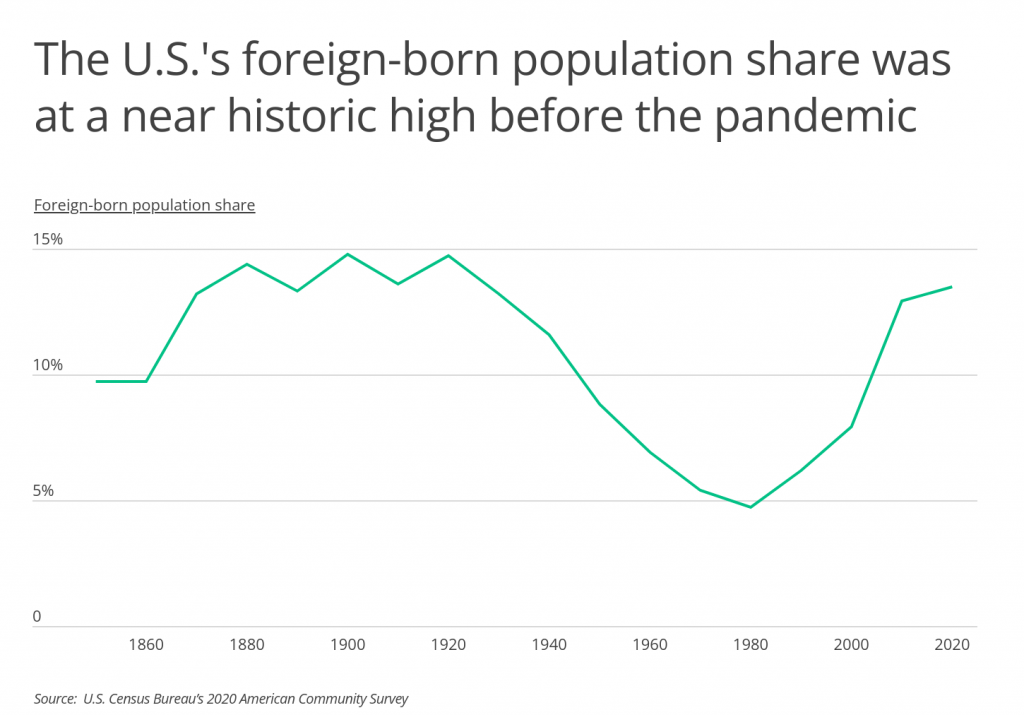
From the period of 1850 to 2020, when the most recent data is available, the foreign-born population share hit a high of 14.8% in 1900. From 1920 to 1980, the share of immigrants fell, dropping to a low of 4.7% in 1980. Until recently, the immigrant share of the population had been climbing and was at a near historic high in 2019 before the pandemic. The share of immigrants dropped slightly in 2020 to 13.5%, down from the 13.7% it had stood at for the last several years.
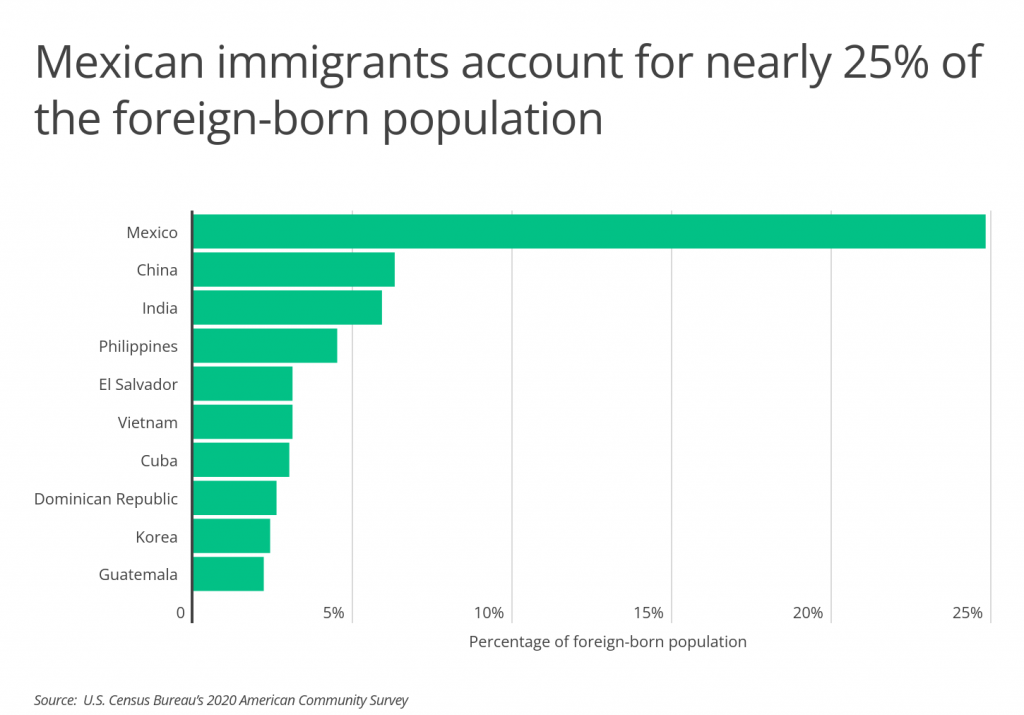
Accounting for 24.8% of the foreign-born population, Mexico claims the largest number of U.S. immigrants. The Chinese and Indian immigrant populations are also large, making up a collective 12.2% of the foreign-born population. Pew Research Center analysis of Census Bureau data shows that about one million immigrants arrive in the U.S. each year, and the most common region for new immigrants is now Asia, which recently surpassed Hispanic countries.
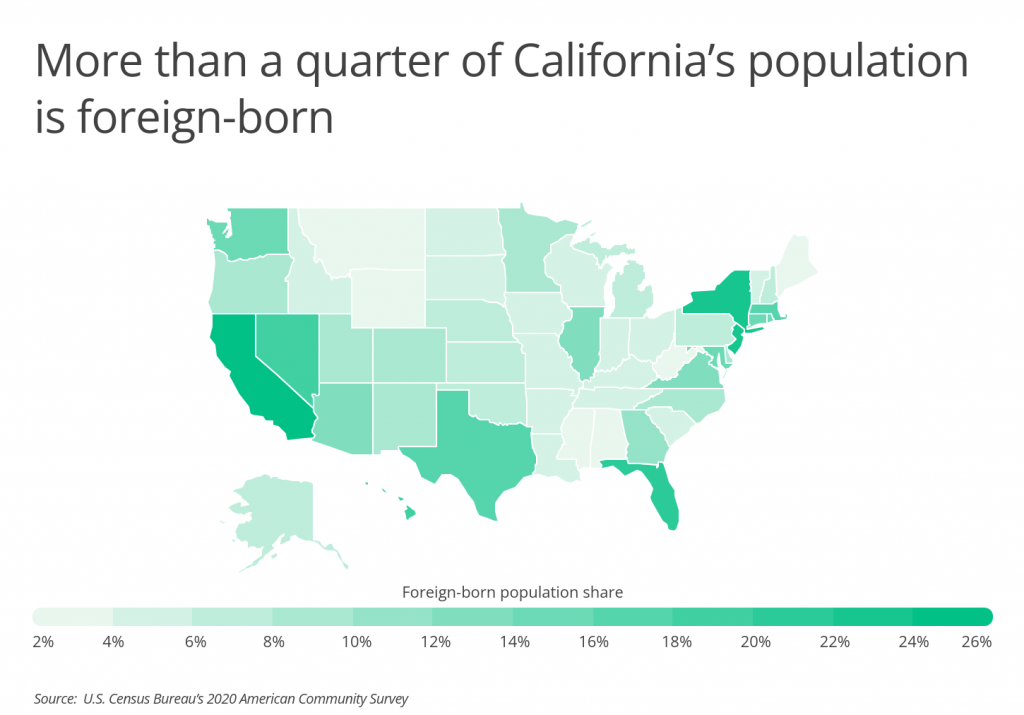
While immigrants live in every U.S. state, some parts of the country have larger foreign-born populations than others. Over one-fourth of California’s population is foreign-born—mostly coming from Mexico—making California the top state for immigrants. New Jersey and New York also have large immigrant populations, with 22.7% and 22.4% of their populations being immigrants, respectively. Alternatively, Montana and West Virginia have very small immigrant populations, accounting for just 2.2% and 1.6% of their populations, respectively.
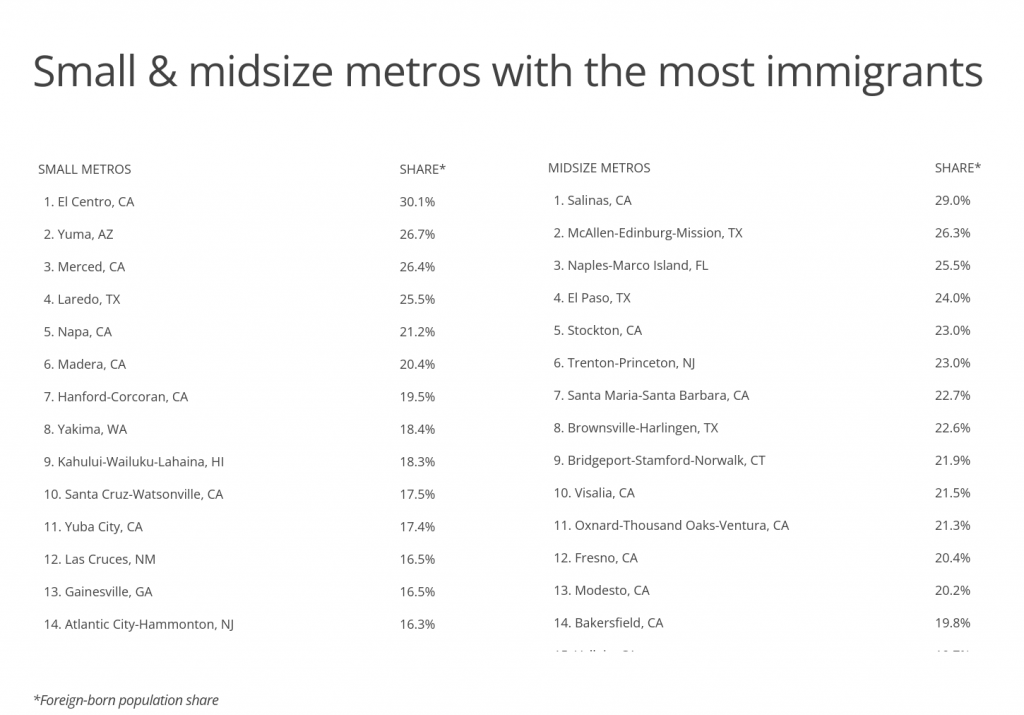
To determine the U.S. metropolitan areas with the largest immigrant populations, researchers at BackgroundChecks.org analyzed the latest data from the U.S. Census Bureau. The researchers ranked metros according to the foreign-born population share. Researchers also calculated the most common country of origin, the total foreign-born population, and the total population.
To improve relevance, only metropolitan areas with at least 100,000 people were included in the analysis. Additionally, metro areas were grouped into the following cohorts based on population size:
- Small metros: 100,000–349,999
- Midsize metros: 350,000–999,999
- Large metros: more than 1,000,000
Here are the metros with the largest immigrant populations.
Large Metros With the Most Immigrants

Photo Credit: Andriy Blokhin / Shutterstock
15. Sacramento-Roseville-Folsom, CA
- Foreign-born population share: 18.5%
- Most common country of origin: Mexico
- Total foreign-born population: 432,837
- Total population: 2,338,866

Photo Credit: f11photo / Shutterstock
14. Dallas-Fort Worth-Arlington, TX
- Foreign-born population share: 18.5%
- Most common country of origin: Mexico
- Total foreign-born population: 1,376,117
- Total population: 7,451,858

Photo Credit: Songquan Deng / Shutterstock
13. Orlando-Kissimmee-Sanford, FL
- Foreign-born population share: 18.8%
- Most common country of origin: Colombia
- Total foreign-born population: 481,158
- Total population: 2,560,260

Photo Credit: Travellaggio / Shutterstock
12. Boston-Cambridge-Newton, MA-NH
- Foreign-born population share: 18.9%
- Most common country of origin: China
- Total foreign-born population: 918,197
- Total population: 4,854,808

Photo Credit: mahaloshine / Shutterstock
11. Seattle-Tacoma-Bellevue, WA
- Foreign-born population share: 19.2%
- Most common country of origin: Mexico
- Total foreign-born population: 754,455
- Total population: 3,928,498

Photo Credit: Jon Bilous / Shutterstock
10. Riverside-San Bernardino-Ontario, CA
- Foreign-born population share: 21.1%
- Most common country of origin: Mexico
- Total foreign-born population: 970,476
- Total population: 4,600,396

Photo Credit: Virrage Images / Shutterstock
9. Las Vegas-Henderson-Paradise, NV
- Foreign-born population share: 22.1%
- Most common country of origin: Mexico
- Total foreign-born population: 492,617
- Total population: 2,228,866

Photo Credit: ESB Professional / Shutterstock
8. Washington-Arlington-Alexandria, DC-VA-MD-WV
- Foreign-born population share: 22.8%
- Most common country of origin: El Salvador
- Total foreign-born population: 1,425,904
- Total population: 6,250,309

Photo Credit: Sean Pavone / Shutterstock
7. San Diego-Chula Vista-Carlsbad, CA
- Foreign-born population share: 22.9%
- Most common country of origin: Mexico
- Total foreign-born population: 762,260
- Total population: 3,323,970

Photo Credit: Tomas Simkus / Shutterstock
6. Houston-The Woodlands-Sugar Land, TX
- Foreign-born population share: 23.3%
- Most common country of origin: Mexico
- Total foreign-born population: 1,623,239
- Total population: 6,979,613

Photo Credit: Lukas Uher / Shutterstock
5. New York-Newark-Jersey City, NY-NJ-PA
- Foreign-born population share: 29.3%
- Most common country of origin: Dominican Republic
- Total foreign-born population: 5,652,129
- Total population: 19,261,570

Photo Credit: yhelfman / Shutterstock
4. San Francisco-Oakland-Berkeley, CA
- Foreign-born population share: 30.7%
- Most common country of origin: China
- Total foreign-born population: 1,443,907
- Total population: 4,709,220

Photo Credit: Sean Pavone / Shutterstock
3. Los Angeles-Long Beach-Anaheim, CA
- Foreign-born population share: 32.7%
- Most common country of origin: Mexico
- Total foreign-born population: 4,325,660
- Total population: 13,211,027

Photo Credit: thetahoeguy / Shutterstock
2. San Jose-Sunnyvale-Santa Clara, CA
- Foreign-born population share: 39.1%
- Most common country of origin: China
- Total foreign-born population: 775,944
- Total population: 1,985,926

Photo Credit: Just dance / Shutterstock
1. Miami-Fort Lauderdale-Pompano Beach, FL
- Foreign-born population share: 40.9%
- Most common country of origin: Cuba
- Total foreign-born population: 2,504,666
- Total population: 6,129,858
Detailed Findings & Methodology
To determine the U.S. metropolitan areas with the largest immigrant populations, researchers at BackgroundChecks.org analyzed the latest data from the U.S. Census Bureau’s 2020 American Community Survey. The researchers ranked metros according to the foreign-born population share. In the event of a tie, the metro with the higher number of immigrants was ranked higher. Researchers also calculated the most common country of origin, the total foreign-born population, and the total population.
To improve relevance, only metropolitan areas with at least 100,000 people were included in the analysis. Additionally, metro areas were grouped into the following cohorts based on population size:
- Small metros: 100,000–349,999
- Midsize metros: 350,000–999,999
- Large metros: more than 1,000,000