
Photo Credit: Andy Dean Photography / Shutterstock
The U.S. housing market appears to be turning a corner after a two-year stretch of high demand and fast-rising prices. Sales prices for homes have begun to level out, as homes sit for longer on the market and sellers show greater willingness to lower their price. Mortgage applications have fallen to their lowest level in more than two decades, after the average rate for a 30-year home loan approximately doubled over the last year amid efforts to combat inflation.
But while lower demand is likely to slow the pace of price increases in the months ahead, these trends will not address a deeper issue in the housing market: a lack of supply. According to research from realtor.com, the U.S. has a deficit of 5.24 million homes, a number that represents a 1.4 million-unit increase over the 2019 figure.
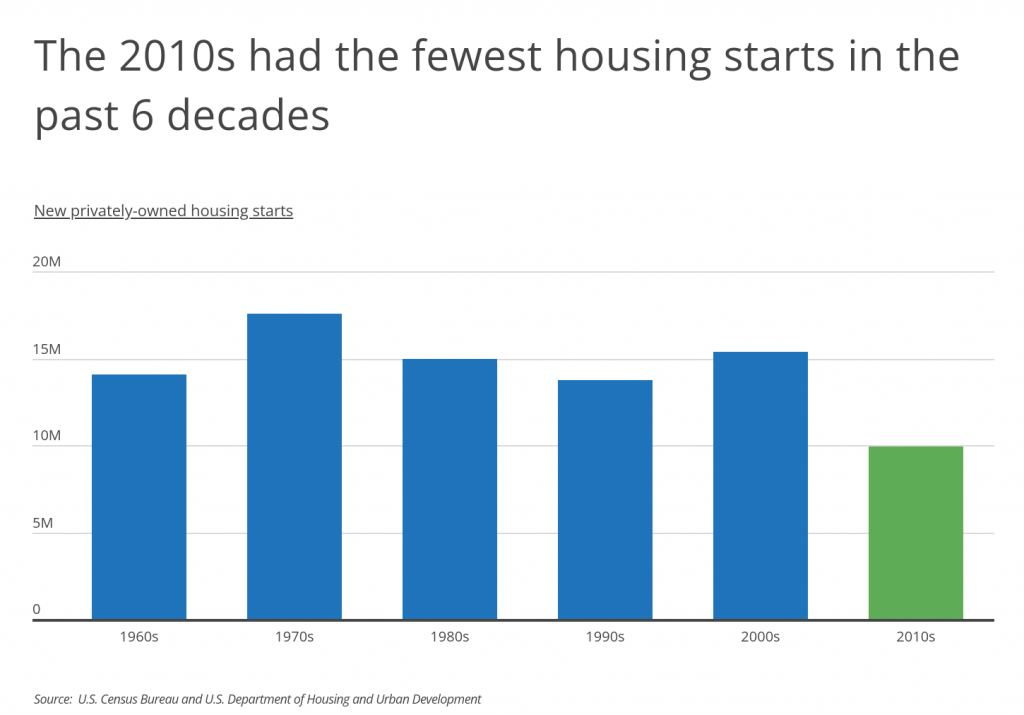
Housing starts have been trending upward since the spring of 2020, but home builders must also make up for lower levels of activity over the last decade. The bursting of the housing bubble in the mid-2000s and the ensuing Great Recession ravaged the construction industry during the 2010s. Thousands of construction firms closed or merged, the industry lost more than 2 million jobs, and the volume and value of construction projects fell off significantly. The downturn had a major consequence for the residential housing market, as the number of new privately-owned housing starts fell by more than 35% from the 2000s to the 2010s.
Today, America’s largest generation, the Millennials, are at their peak homebuying age, and America’s second-largest generation, the Baby Boomers, are increasingly choosing to age in place rather than downsize their homes. Coupled with a lack of supply, these demographic forces have left the U.S. with an insufficient housing stock available for would-be homebuyers. The red-hot market of the last two years merely put this reality in sharper relief.
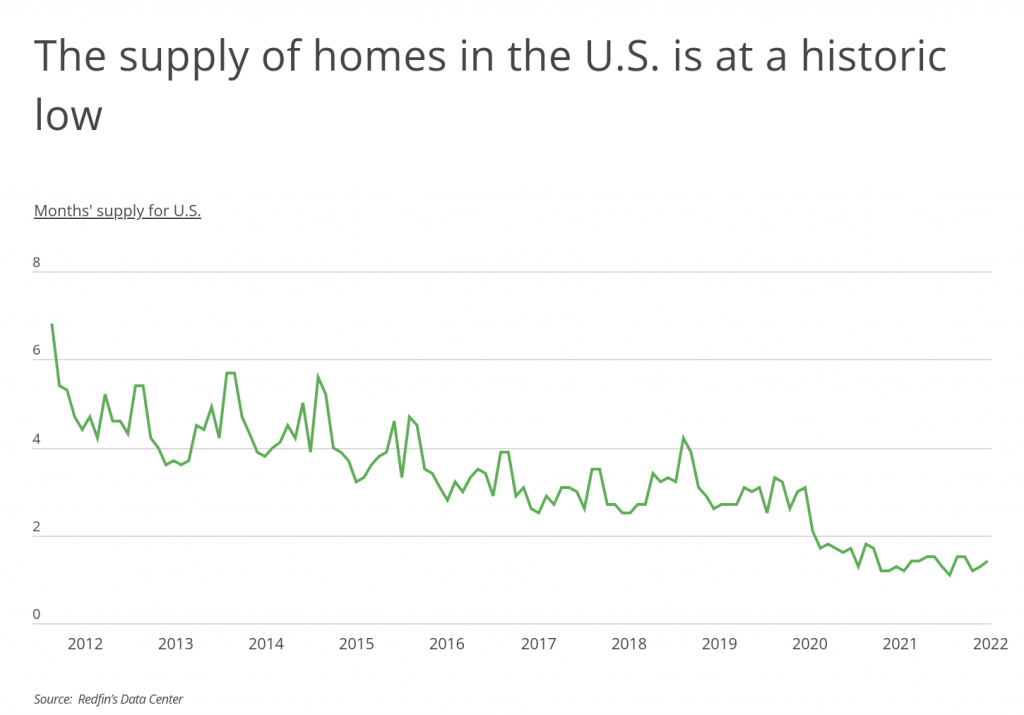
The pandemic-era real estate market sent the supply of homes on the market to all-time lows over the last two years. The months’ supply of homes, which measures how long it would take the current supply of homes to sell at the current sales pace, fell by more than 46% from May 2019 to May 2022. But even before the pandemic, the months’ supply of homes was on a downward trajectory dating back at least a decade: the national months’ supply of homes topped four in just one month over the last six years.
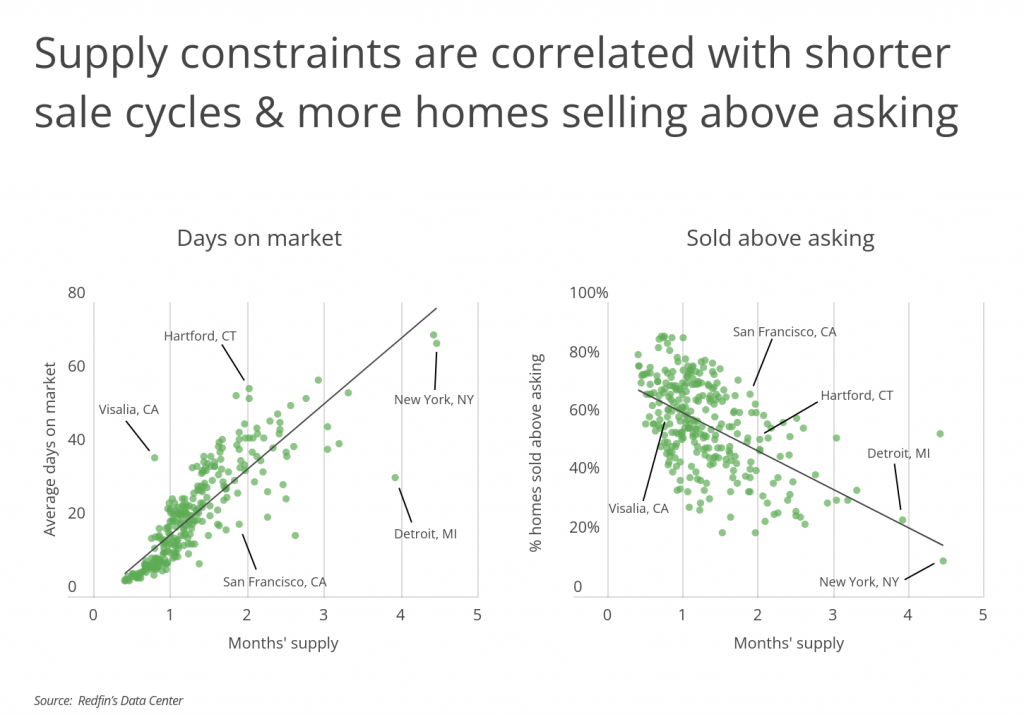
Months’ supply of homes is an especially important indicator in the real estate market because it correlates with how long homes spend on the market and what they sell for. As the months’ supply of homes increases, homes spend more days on the market on average and a lower percentage of homes sell above asking price. Conversely, when months’ supply is low, homes spend less time on the market and a higher percentage of homes sell above their initial list price.
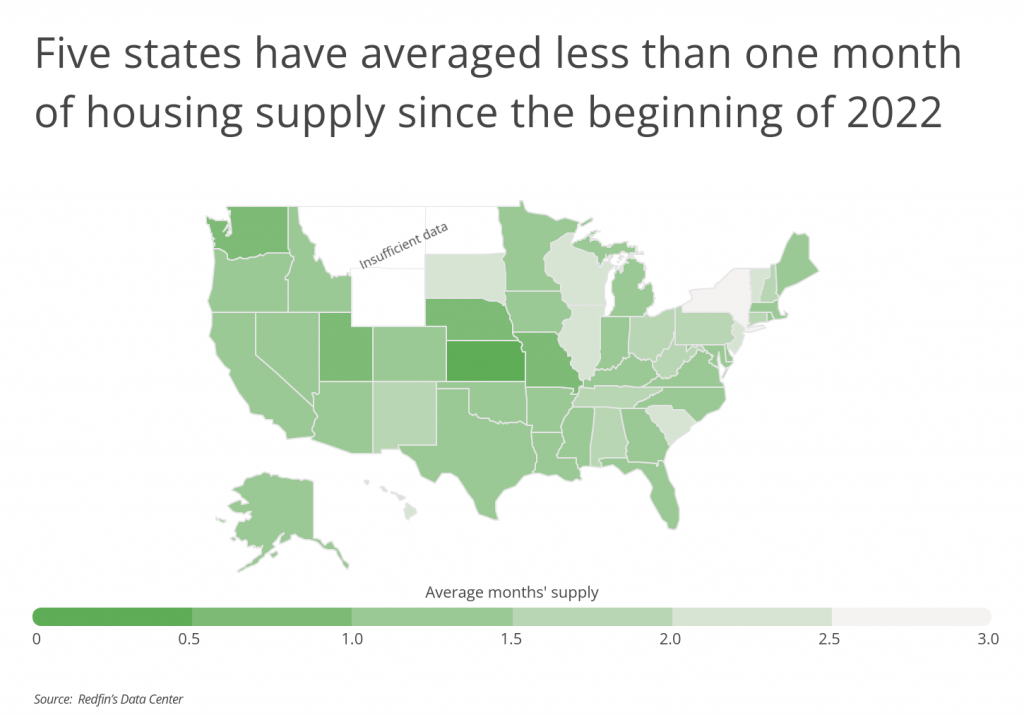
Months’ supply has been low nationwide, but some locations have unusually low levels of inventory. Five states—Kansas, Washington, Nebraska, Utah, and Missouri—have averaged less than one month of housing supply since the beginning of 2022. In contrast, eight states have averaged more than 2 months’ supply, including expensive states for housing like New York, New Jersey, and Hawaii. And at the metro level, the locations with the lowest levels of inventory include hot markets like the Denver area, Seattle, and San Jose.
The data used in this analysis is from January 2022 through May 2022, sourced from Redfin. To determine the locations with the least home inventory, researchers at Inspection Support Network calculated the average months’ supply over the time period. In the event of a tie, the location with the lower average days on market was ranked higher.
Here are the U.S. cities with the least home inventory.
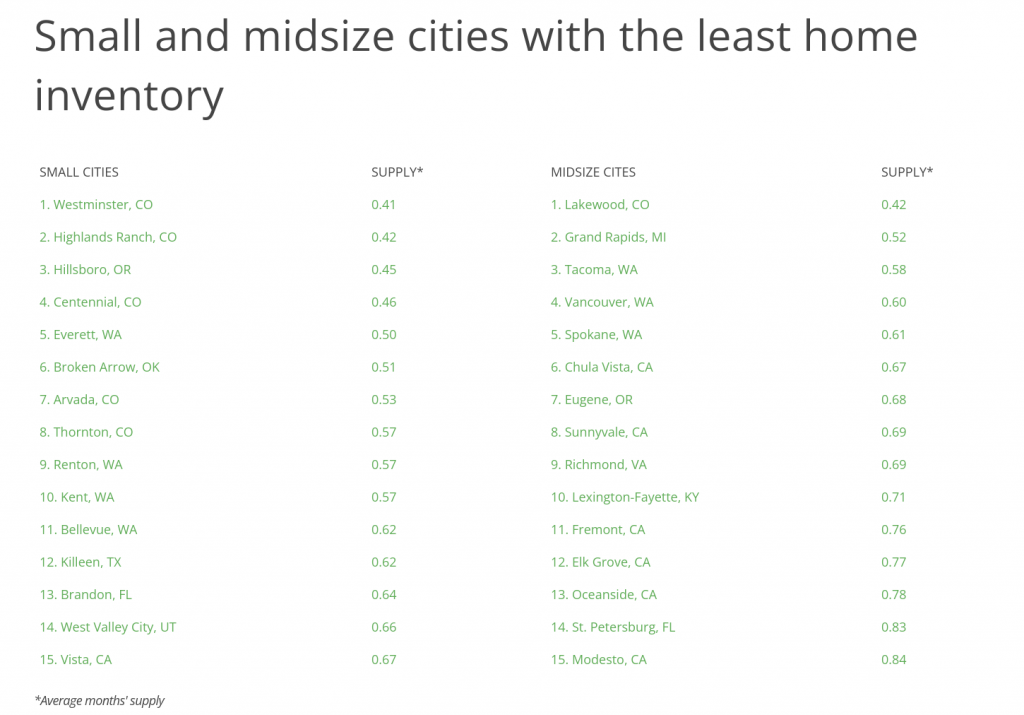
Large Cities With the Least Home Inventory

Photo Credit: Matt Gush / Shutterstock
15. Fresno, CA
- Average months’ supply: 0.93
- Average days on market: 9.9
- Percentage of homes sold above asking: 64.6%
- Median sale price: $375,087

Photo Credit: Peter Witham / Shutterstock
14. Arlington, TX
- Average months’ supply: 0.92
- Average days on market: 15.3
- Percentage of homes sold above asking: 70.4%
- Median sale price: $336,947

Photo Credit: Kevin J King / Shutterstock
13. Tampa, FL
- Average months’ supply: 0.91
- Average days on market: 8.8
- Percentage of homes sold above asking: 51.2%
- Median sale price: $377,420

Photo Credit: Natalia Bratslavsky / Shutterstock
12. Oklahoma City, OK
- Average months’ supply: 0.90
- Average days on market: 7.1
- Percentage of homes sold above asking: 47.2%
- Median sale price: $250,511

Photo Credit: Andriy Blokhin / Shutterstock
11. Sacramento, CA
- Average months’ supply: 0.84
- Average days on market: 8.2
- Percentage of homes sold above asking: 71.5%
- Median sale price: $502,869

Photo Credit: Valiik30 / Shutterstock
10. Tulsa, OK
- Average months’ supply: 0.83
- Average days on market: 9.2
- Percentage of homes sold above asking: 47.5%
- Median sale price: $210,230

Photo Credit: Sean Pavone / Shutterstock
9. San Diego, CA
- Average months’ supply: 0.82
- Average days on market: 8.9
- Percentage of homes sold above asking: 67.6%
- Median sale price: $884,164
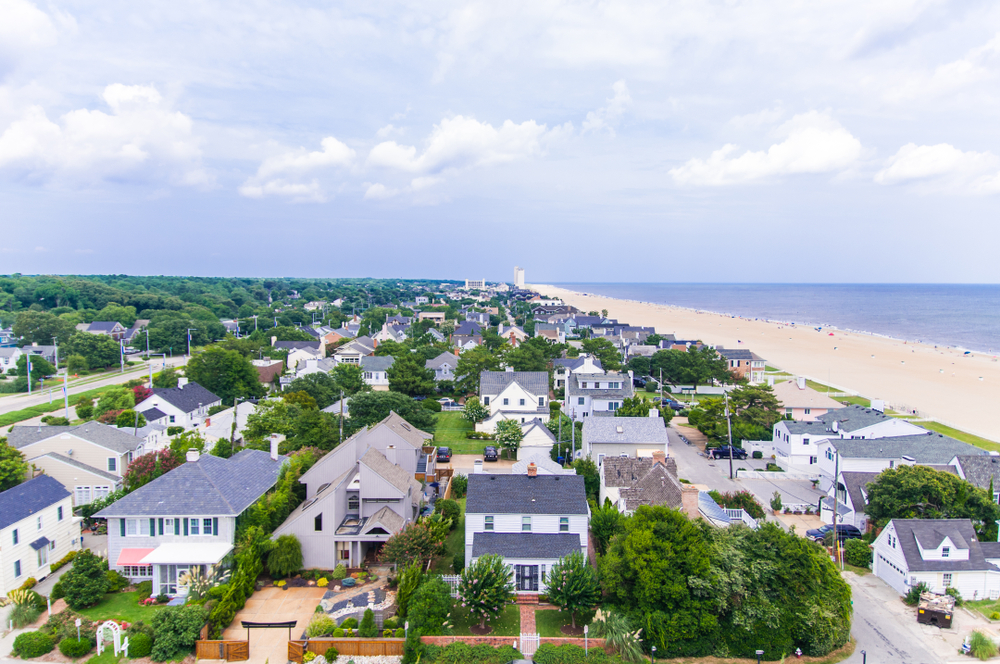
Photo Credit: John S. Quinn / Shutterstock
8. Virginia Beach, VA
- Average months’ supply: 0.81
- Average days on market: 16.1
- Percentage of homes sold above asking: 63.5%
- Median sale price: $337,984

Photo Credit: Agnieszka Gaul / Shutterstock
7. Indianapolis, IN
- Average months’ supply: 0.79
- Average days on market: 5.9
- Percentage of homes sold above asking: 48.4%
- Median sale price: $228,901

Photo Credit: Sean Pavone / Shutterstock
6. Wichita, KS
- Average months’ supply: 0.76
- Average days on market: 15.8
- Percentage of homes sold above asking: 52.6%
- Median sale price: $192,786
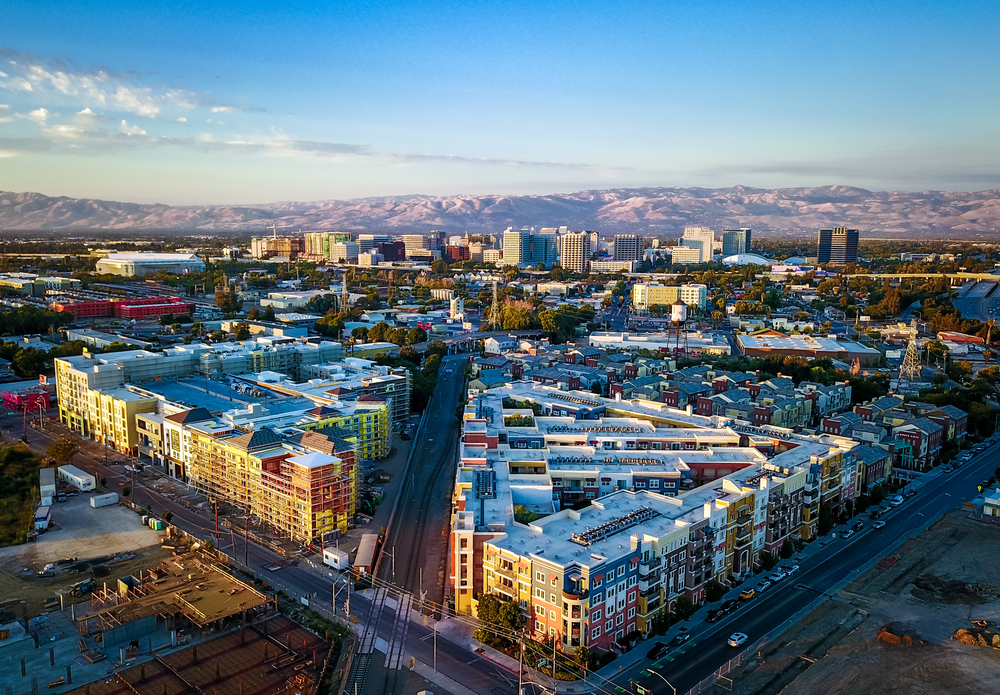
Photo Credit: Uladzik Kryhin / Shutterstock
5. San Jose, CA
- Average months’ supply: 0.75
- Average days on market: 8.5
- Percentage of homes sold above asking: 88.0%
- Median sale price: $1,414,963

Photo Credit: Jeremy Janus / Shutterstock
4. Seattle, WA
- Average months’ supply: 0.68
- Average days on market: 7.7
- Percentage of homes sold above asking: 58.2%
- Median sale price: $850,279

Photo Credit: Jonathannsegal / Shutterstock
3. Omaha, NE
- Average months’ supply: 0.56
- Average days on market: 5.6
- Percentage of homes sold above asking: 61.2%
- Median sale price: $250,721

Photo Credit: Roschetzky Photography / Shutterstock
2. Denver, CO
- Average months’ supply: 0.56
- Average days on market: 5.3
- Percentage of homes sold above asking: 68.6%
- Median sale price: $589,250
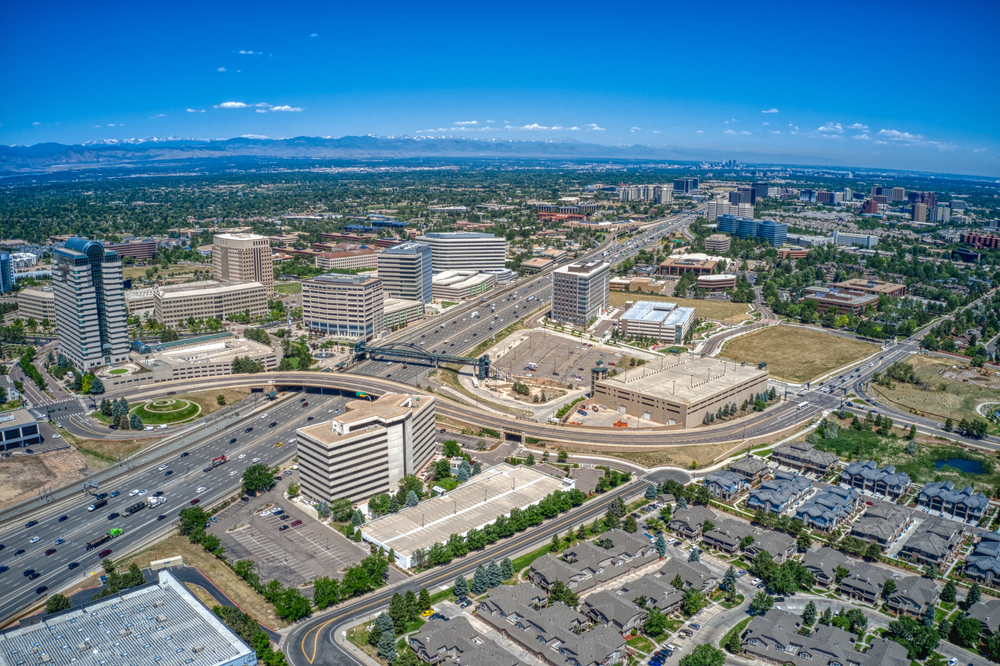
Photo Credit: Jacob Boomsma / Shutterstock
1. Aurora, CO
- Average months’ supply: 0.47
- Average days on market: 4.3
- Percentage of homes sold above asking: 75.3%
- Median sale price: $485,087
Detailed Findings & Methodology
The data used in this analysis is from Redfin’s Data Center, using data from January 2022 through May 2022. To determine the locations with the least home inventory, researchers calculated the average number of months of supply over the time period, with lower values being ranked higher. In the event of a tie, the location with the lower average days on market was ranked higher. To improve relevance, only cities with at least 100,000 residents were included. Additionally, cities were grouped into cohorts based on population size: small (100,000–149,999), midsize (150,000–349,999), and large (350,000 or more). Note, only locations with complete data for all fields were considered in this analysis.