
Photo Credit: Zivica Kerkez / Shutterstock
2022 has brought some of the most noteworthy victories for organized labor in the U.S. in a number of years. Workers at major corporations like Starbucks, Amazon, and Apple have led successful union drives. Petitions for union elections filed at the National Labor Relations Board are up by more than 50% over last year. And under President Joe Biden, an avowed labor advocate, Congress has been deliberating legislation that would strengthen unions and make it easier to organize.
Organized labor in the U.S. has historically been a powerful advocate for workers. Unions have been a driving force behind many reforms that are now fundamental labor protections, like the minimum wage, overtime pay, and child labor laws, and an influential interest in U.S. elections. At the height of labor’s strength in the U.S., the union membership rate among all workers was 34.8%.
But unionization has been on a steady downward trajectory in recent decades. Workers in heavily unionized fields like manufacturing lost power amid the economic downturn and high unemployment of the late 1970s and early 1980s. Globalization and free trade agreements made it easier for employers to offshore jobs to less expensive labor markets, and automation and other technological advances have also decreased the number of workers in unionized jobs. Deregulation and other policy changes like right-to-work laws have decreased union strength. These shifts sharply cut down the share of U.S. workers in unions.
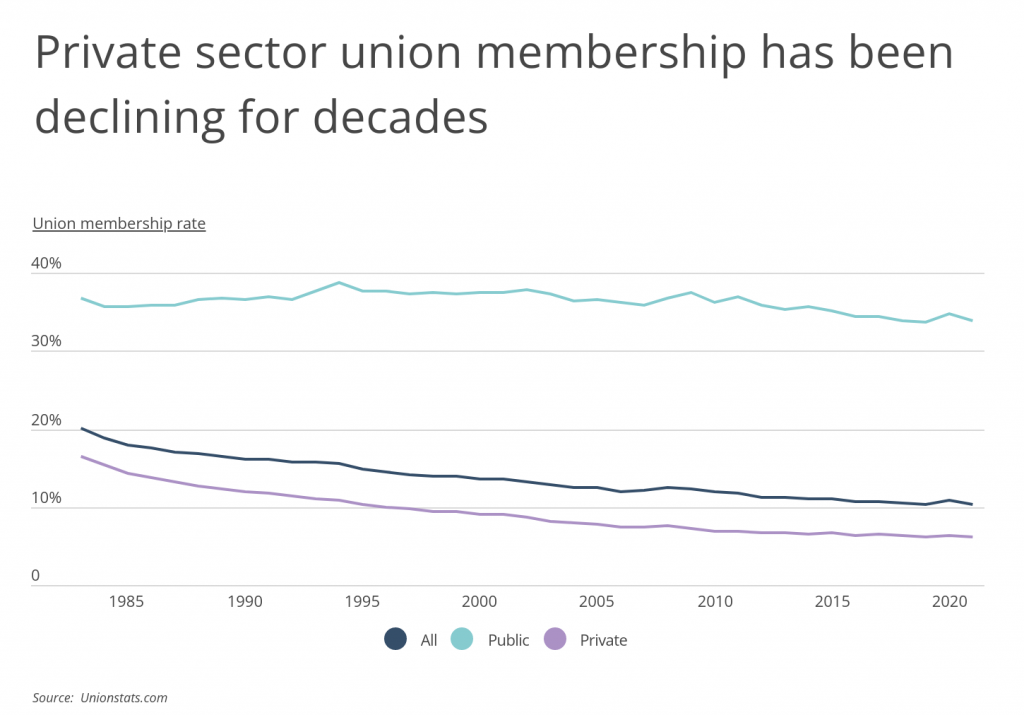
Today, only one in 10 U.S. employees (10.3%) is a member of a union, less than half the share of union members 40 years ago. Much of this decline has been driven by declines in private sector union membership. Since 1980, the private sector union membership rate has fallen from 20.1% to just 6.1% today. In contrast, public sector union membership has only declined by two percentage points in that span, from 35.9% to 33.9%.
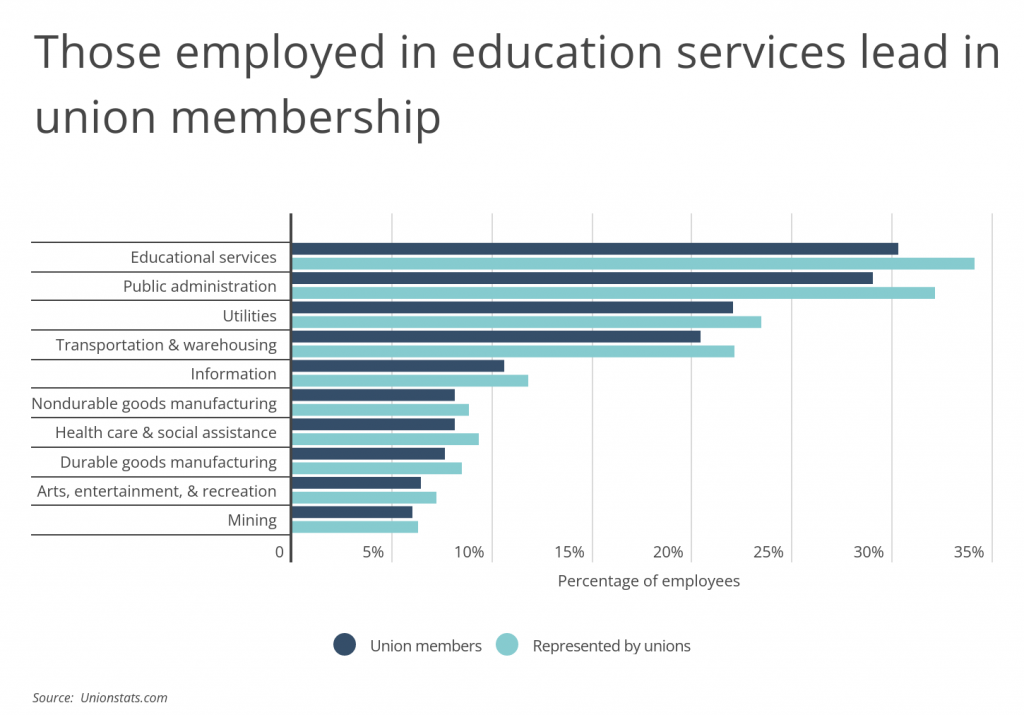
Despite the downward trend in union participation overall, parts of the economy continue to have fairly strong union participation. Because public sector employees tend to join unions at higher rates, most of the industries with the highest rates of union membership are dominated by public sector employers. The educational services industry, which includes public schools and universities, has the highest rates of unionization. 30.3% of these professionals are union members, and a total of 34.1% are represented by unions. Other industries with a strong public sector presence are also among the most unionized, including public administration (29% union members) and utilities (22% union members).
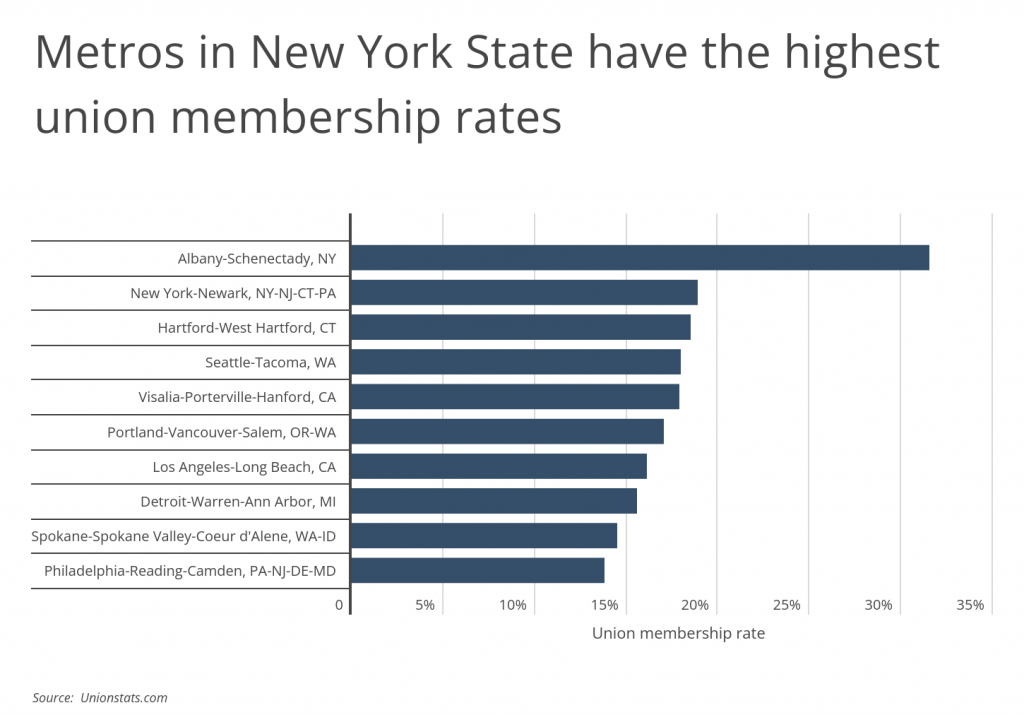
Some locations in the U.S. have also continued to maintain higher-than-average union participation. Locations in the Northeast and on the West Coast tend to have the largest union presences, with New York being one of the nation’s leading areas for union activity. New York is one of only two states with a union membership rate above 20%, and fittingly, the Albany and New York City metros are the most unionized metros in the United States. Albany, the home of New York’s state government, has a union membership rate of 31.5%, while the New York City metro has a union membership rate of 18.9%.
And for certain occupations, unions are well entrenched and likely to continue to be a force. For roles like teachers and police officers, around half of workers are union members or otherwise represented by a union. Trades like electricians and plumbers also boast union membership rates above the nationwide rate.
The data used in this analysis is from Unionstats.com. To determine the most unionized occupations, researchers at Smartest Dollar calculated the union membership rate for each occupation. In the event of a tie, the occupation with the greater union coverage rate was ranked higher. To improve relevance, only the top 100 occupations, by number of U.S. employees, were considered in this analysis.
Here are the most unionized occupations.
Most Unionized Occupations

Photo Credit: MIND AND I / Shutterstock
15. Carpenters
- Union membership rate: 15.4%
- Union coverage rate: 16.8%
- Total union membership: 136,930
- Total union coverage: 150,104

Photo Credit: Joyseulay / Shutterstock
14. Heating, air conditioning, and refrigeration mechanics and installers
- Union membership rate: 15.4%
- Union coverage rate: 17.8%
- Total union membership: 59,327
- Total union coverage: 68,592
Photo Credit: Somchai Stock / Shutterstock
13. Industrial and refractory machinery mechanics
- Union membership rate: 15.7%
- Union coverage rate: 16.8%
- Total union membership: 68,017
- Total union coverage: 72,819

Photo Credit: fizkes / Shutterstock
12. Education and childcare administrators
- Union membership rate: 16.1%
- Union coverage rate: 19.2%
- Total union membership: 143,766
- Total union coverage: 170,835

Photo Credit: Zivica Kerkez / Shutterstock
11. Welding, soldering, and brazing workers
- Union membership rate: 16.2%
- Union coverage rate: 17.7%
- Total union membership: 84,319
- Total union coverage: 92,332

Photo Credit: Rawpixel.com / Shutterstock
10. Registered nurses
- Union membership rate: 17.1%
- Union coverage rate: 19.2%
- Total union membership: 537,329
- Total union coverage: 603,554

Photo Credit: wavebreakmedia / Shutterstock
9. Preschool and kindergarten teachers
- Union membership rate: 18.1%
- Union coverage rate: 21.1%
- Total union membership: 104,394
- Total union coverage: 121,553

Photo Credit: dotshock / Shutterstock
8. Postsecondary teachers
- Union membership rate: 20.0%
- Union coverage rate: 22.9%
- Total union membership: 229,467
- Total union coverage: 263,019

Photo Credit: YAKOBCHUK VIACHESLAV / Shutterstock
7. Social workers, all other
- Union membership rate: 20.4%
- Union coverage rate: 22.0%
- Total union membership: 132,423
- Total union coverage: 142,878

Photo Credit: Dagmara K / Shutterstock
6. Plumbers, pipefitters, and steamfitters
- Union membership rate: 24.8%
- Union coverage rate: 26.4%
- Total union membership: 128,554
- Total union coverage: 136,646

Photo Credit: Drazen Zigic / Shutterstock
5. Teaching assistants
- Union membership rate: 26.7%
- Union coverage rate: 30.3%
- Total union membership: 344,023
- Total union coverage: 389,581

Photo Credit: Virrage Images / Shutterstock
4. Electricians
- Union membership rate: 31.2%
- Union coverage rate: 31.7%
- Total union membership: 238,369
- Total union coverage: 242,154

Photo Credit: Ground Picture / Shutterstock
3. Elementary and middle school teachers
- Union membership rate: 46.6%
- Union coverage rate: 51.6%
- Total union membership: 1,519,386
- Total union coverage: 1,682,758

Photo Credit: Monkey Business Images / Shutterstock
2. Secondary school teachers
- Union membership rate: 49.6%
- Union coverage rate: 55.1%
- Total union membership: 464,121
- Total union coverage: 515,333

Photo Credit: LightField Studios / Shutterstock
1. Police officers
- Union membership rate: 52.8%
- Union coverage rate: 55.7%
- Total union membership: 405,642
- Total union coverage: 428,165
Detailed Findings & Methodology
The data used in this analysis is from Unionstats.com. To determine the most unionized occupations, researchers calculated the union membership rate for each occupation. In the event of a tie, the occupation with the greater union coverage rate was ranked higher. To improve relevance, only the top 100 occupations, by number of U.S. employees, were considered in this analysis.


