
Photo Credit: Andy Dean Photography / Shutterstock
The red-hot real estate market may finally be cooling off, but that doesn’t mean that homebuying is getting much easier.
The market has shown encouraging signs for buyers in recent months. Mortgage applications are down, which means that fewer buyers are competing in the market. Homes are spending more time on the market, and sellers are more inclined to lower prices. And buyers are walking away from deals more often, which suggests that they are regaining negotiating power after an extremely seller-friendly stretch.
But affordability remains a major challenge, especially for first-time homebuyers. Mortgage interest rates have increased dramatically since the start of 2022, adding hundreds of dollars to prospective borrowers’ monthly mortgage payments. Persistently high inflation over the last year is eating into household budgets, leaving less money available to put toward a home purchase. And inflation has also raised the cost of homes, as high demand and low supply have driven prices to record levels.
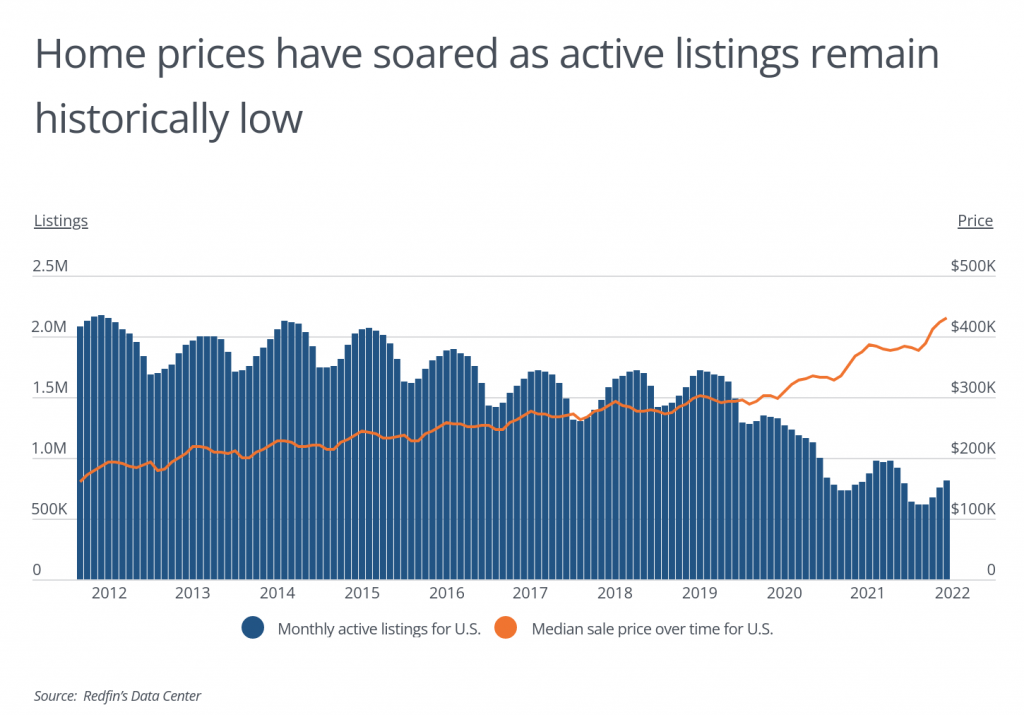
Declining inventory and rising prices have been exacerbated in the last two years, but the market has been experiencing these trends for most of the last decade. Monthly active real estate listings regularly topped 2 million during the busy season from 2012 until 2015 but began to fall off in subsequent years. Listings have not exceeded 1.5 million since late 2019 and last topped 1 million in November 2020. Meanwhile, median sales prices have more than doubled over the last decade, including a 50% increase from the beginning of 2020 to now.
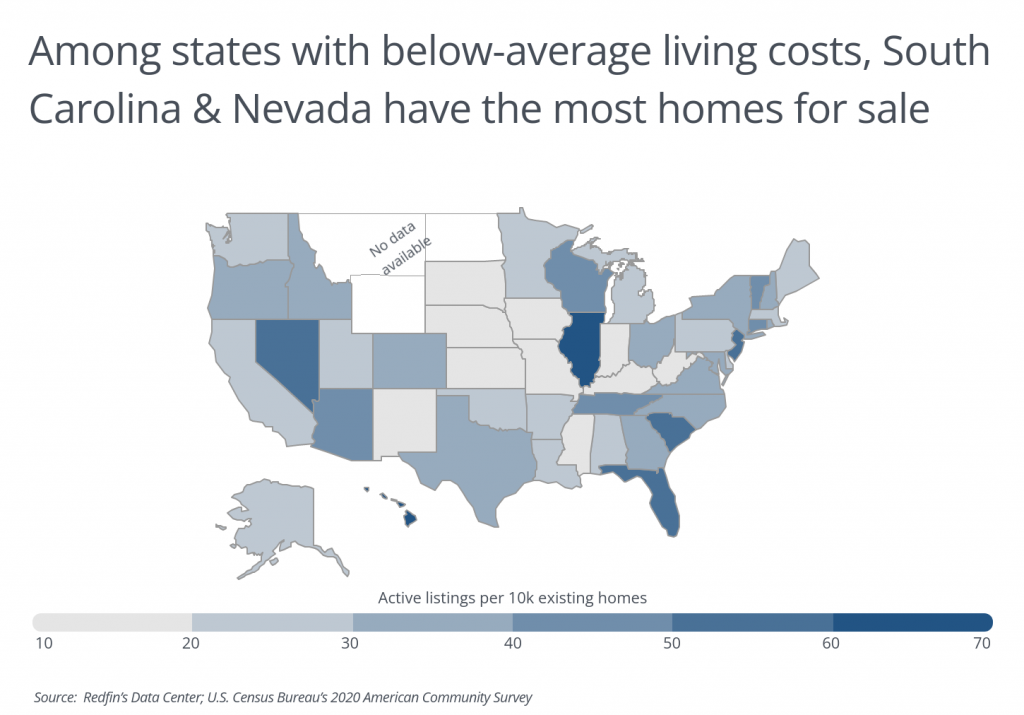
The affordability crunch now means that many expensive locations have more inventory available because buyers have been priced out of their markets. Hawaii is among the nation’s most expensive states, especially for housing, and also currently leads the U.S. with 69.1 active real estate listings per 10,000 existing homes. Other high-cost locations like New Jersey and Connecticut also rank highly for available inventory. In contrast, low-cost states including New Mexico, West Virginia, and Kansas have fewer than 10 active listings for sale per 10,000 homes.
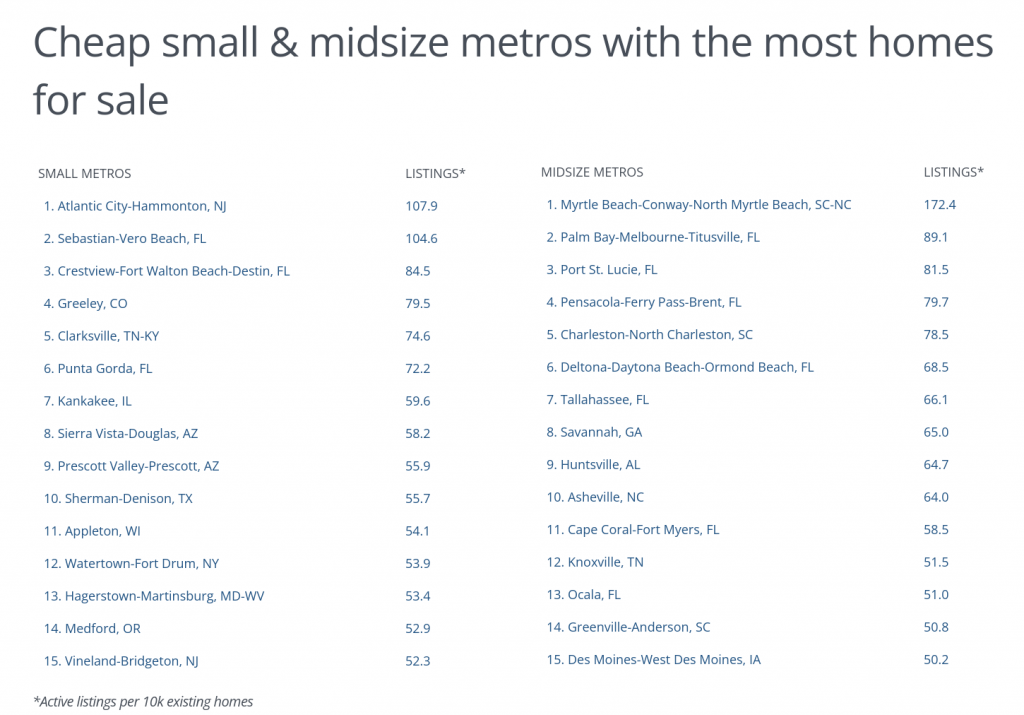
Despite the challenges of the current real estate market, shoppers looking for locations that are both affordable and have adequate inventory do have some options available. South Carolina, Nevada, and Arizona all have below-average cost of living, but rank in the top 10 for active listings per 10,000 existing homes. And at the metro level, cities in these states–such as Myrtle Beach, Las Vegas, and Tucson, respectively–are among the best for homebuyers seeking available inventory and affordable living.
The data used in this analysis is from Redfin’s Data Center, the U.S. Bureau of Economic Analysis’ Regional Price Parities, and the U.S. Census Bureau’s 2020 American Community Survey. To determine the cheap metropolitan areas with the most home inventory, researchers at Stessa calculated the number of active listings per 10,000 existing homes among locations with a cost of living below the national average. The number of active listings reflects the total number of active listings on the last day of each month, averaged over the first five months of 2022. In the event of a tie, the metro with the lower cost of living was ranked higher. To improve relevance, only metropolitan areas with at least 100,000 residents were included. Additionally, metros were grouped into cohorts based on population size: small (100,000–349,999), midsize (350,000–999,999), and large (1,000,000 or more). Only locations with complete monthly data for 2022 were considered in this analysis.
Here are the cheap U.S. metropolitan areas with the most home inventory.
Cheap Large Metros With the Most Homes for Sale

Photo Credit: Infinity Moments LLC / Shutterstock
15. Orlando-Kissimmee-Sanford, FL
- Active listings per 10k existing homes: 35.9
- Cost of living (compared to average): -1.3%
- Median sale price: $376,365
- Percentage of listings with a price cut: 20.5%
- Average days on market: 9.7

Photo Credit: Sean Pavone / Shutterstock
14. New Orleans-Metairie, LA
- Active listings per 10k existing homes: 38.9
- Cost of living (compared to average): -3.1%
- Median sale price: $288,501
- Percentage of listings with a price cut: 28.2%
- Average days on market: 14.2

Photo Credit: Zack Frank / Shutterstock
13. Columbus, OH
- Active listings per 10k existing homes: 41.2
- Cost of living (compared to average): -5.8%
- Median sale price: $297,148
- Percentage of listings with a price cut: 10.8%
- Average days on market: 35.1

Photo Credit: ESB Professional / Shutterstock
12. Atlanta-Sandy Springs-Alpharetta, GA
- Active listings per 10k existing homes: 43.7
- Cost of living (compared to average): -1.8%
- Median sale price: $371,633
- Percentage of listings with a price cut: 21.0%
- Average days on market: 14.7

Photo Credit: Rosamar / Shutterstock
11. Cincinnati, OH-KY-IN
- Active listings per 10k existing homes: 44.3
- Cost of living (compared to average): -6.5%
- Median sale price: $246,551
- Percentage of listings with a price cut: 11.5%
- Average days on market: 37.6

Photo Credit: f11photo / Shutterstock
10. Charlotte-Concord-Gastonia, NC-SC
- Active listings per 10k existing homes: 44.5
- Cost of living (compared to average): -5.4%
- Median sale price: $380,303
- Percentage of listings with a price cut: 15.6%
- Average days on market: 28.9

Photo Credit: Andrew Yoshiki / Shutterstock
9. San Antonio-New Braunfels, TX
- Active listings per 10k existing homes: 45.0
- Cost of living (compared to average): -2.1%
- Median sale price: $322,390
- Percentage of listings with a price cut: 20.1%
- Average days on market: 19.8

Photo Credit: Farid Sani / Shutterstock
8. Raleigh-Cary, NC
- Active listings per 10k existing homes: 46.1
- Cost of living (compared to average): -4.3%
- Median sale price: $421,939
- Percentage of listings with a price cut: 9.6%
- Average days on market: 27.3

Photo Credit: Paul Brady Photography / Shutterstock
7. Milwaukee-Waukesha, WI
- Active listings per 10k existing homes: 46.9
- Cost of living (compared to average): -4.1%
- Median sale price: $263,848
- Percentage of listings with a price cut: 11.8%
- Average days on market: 43.5

Photo Credit: Rob Hainer / Shutterstock
6. Birmingham-Hoover, AL
- Active listings per 10k existing homes: 48.9
- Cost of living (compared to average): -7.4%
- Median sale price: $277,144
- Percentage of listings with a price cut: 14.7%
- Average days on market: 35.0

Photo Credit: Steve Heap / Shutterstock
5. Nashville-Davidson–Murfreesboro–Franklin, TN
- Active listings per 10k existing homes: 49.9
- Cost of living (compared to average): -3.0%
- Median sale price: $435,712
- Percentage of listings with a price cut: 13.9%
- Average days on market: 21.3

Photo Credit: Jason Sponseller / Shutterstock
4. Pittsburgh, PA
- Active listings per 10k existing homes: 51.1
- Cost of living (compared to average): -4.3%
- Median sale price: $212,188
- Percentage of listings with a price cut: 15.3%
- Average days on market: 53.3

Photo Credit: GagliardiPhotography / Shutterstock
3. Jacksonville, FL
- Active listings per 10k existing homes: 53.0
- Cost of living (compared to average): -3.7%
- Median sale price: $347,824
- Percentage of listings with a price cut: 17.7%
- Average days on market: 23.4

Photo Credit: LHBLLC / Shutterstock
2. Tucson, AZ
- Active listings per 10k existing homes: 53.4
- Cost of living (compared to average): -6.2%
- Median sale price: $343,581
- Percentage of listings with a price cut: 13.3%
- Average days on market: 37.7

Photo Credit: Andrey Bayda / Shutterstock
1. Las Vegas-Henderson-Paradise, NV
- Active listings per 10k existing homes: 53.6
- Cost of living (compared to average): -2.8%
- Median sale price: $431,299
- Percentage of listings with a price cut: 16.7%
- Average days on market: 20.5
Detailed Findings & Methodology
The data used in this analysis is from Redfin’s Data Center, the U.S. Bureau of Economic Analysis’ Regional Price Parities, and the U.S. Census Bureau’s 2020 American Community Survey. To determine the cheap metropolitan areas with the most home inventory, researchers calculated the number of active listings per 10,000 existing homes among locations with a cost of living below the national average. The number of active listings reflects the total number of active listings on the last day of each month, averaged over the first five months of 2022. In the event of a tie, the metro with the lower cost of living was ranked higher. To improve relevance, only metropolitan areas with at least 100,000 residents were included. Additionally, metros were grouped into cohorts based on population size: small (100,000–349,999), midsize (350,000–999,999), and large (1,000,000 or more). Only locations with complete monthly data for 2022 were considered in this analysis.