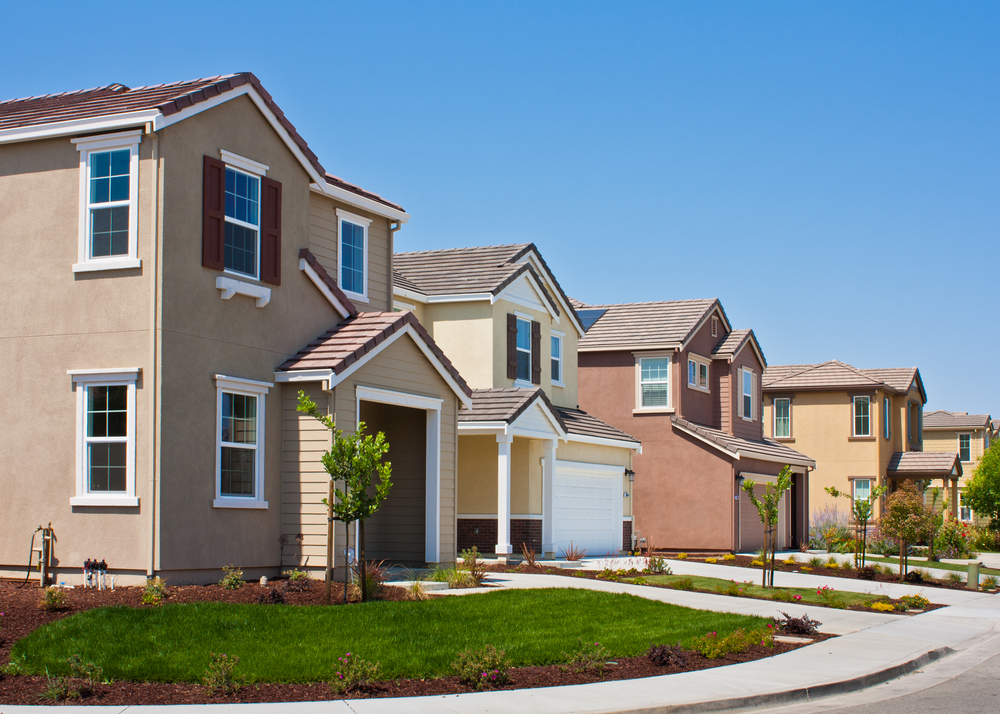
Photo Credit: pbk-pg / Shutterstock
The last two years have shown that the stock of housing in the U.S. is inadequate for the country’s needs. Fast-rising home prices and rents nationwide illustrate that supply has failed to keep up with housing demand. Experts at federal mortgage backer Freddie Mac estimate that the U.S. is nearly 4 million housing units short of what the population needs.
But another challenge is that America’s housing stock is getting older. Today, the median age of a housing unit in the U.S. is 42 years, a figure that has risen steadily over the last two decades. And many older homes are located in places where population growth is flat or slower than in other parts of the country. The result is an imbalance between the locations where housing is more plentiful or affordable and the locations where people are trying to live.
And older homes can have additional downsides. While some residents appreciate the period charms of an older home, these homes tend to have more maintenance problems and lower energy efficiency, which can raise costs of ownership. They are also more likely to have used dangerous materials like asbestos, lead paint, or radon, which create health risks.
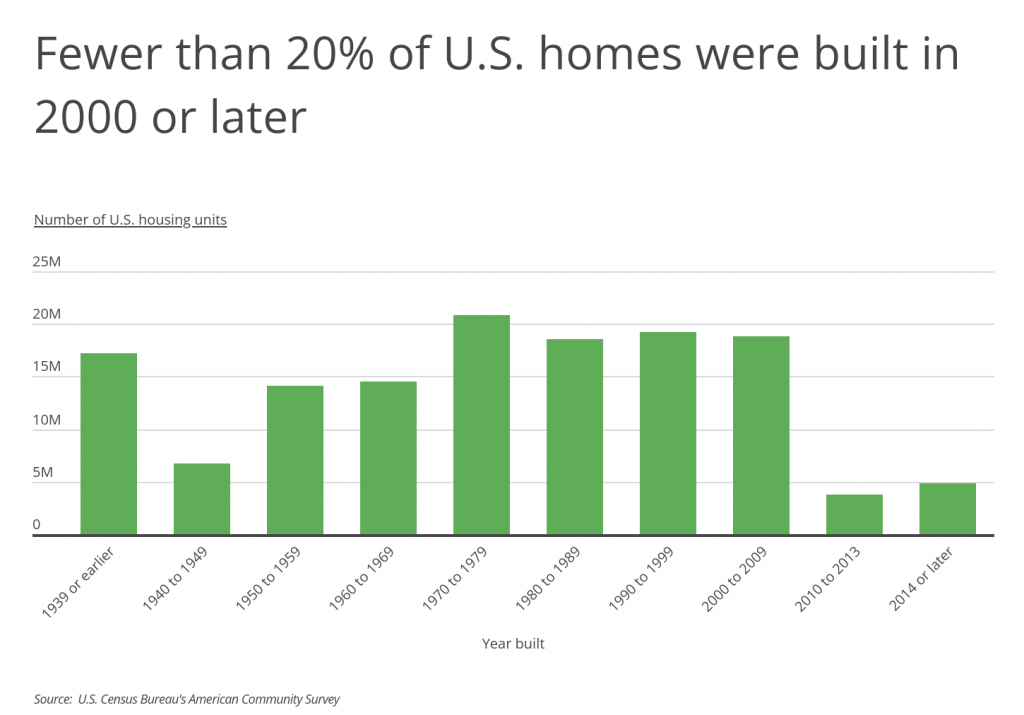
One primary reason for both the shortage and aging of America’s housing stock is the collapse of the building industry after the Great Recession. From 2000 to 2009, when the housing boom reached its peak, new construction kept pace with historical levels as builders added nearly 19 million new homes in that decade. But when the bubble burst and the recession set in at the end of the decade, the rate at which the U.S. added housing fell off dramatically. Since 2010, the U.S. has added only 8.6 million new housing units.
The consequences of underbuilding have played out dramatically over the last two years. With too few homes on the market, competition for residential real estate has been high. Home values have skyrocketed since the beginning of the COVID-19 pandemic, with the median sales price in the U.S. up by more than one-third since 2020. In turn, these increases have priced more prospective buyers out of the market, which has left more people competing for rentals and driving prices higher there as well.
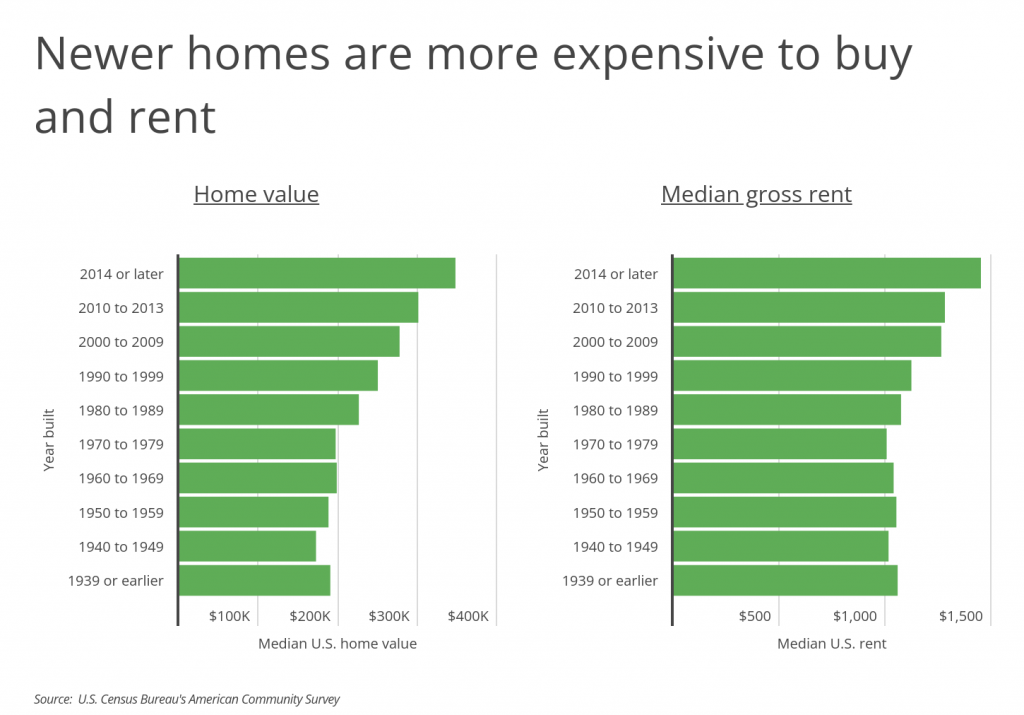
Newer homes already tend to be more expensive because they have more desirable modern designs, amenities, and materials, so people are willing to pay higher home values and rents to live in these units. A unit built after 2014 sells for more than 15% higher and rents for 13% higher than a home built just a few years prior, from 2010 to 2013. With construction costs increasing, the gap could widen in future years.
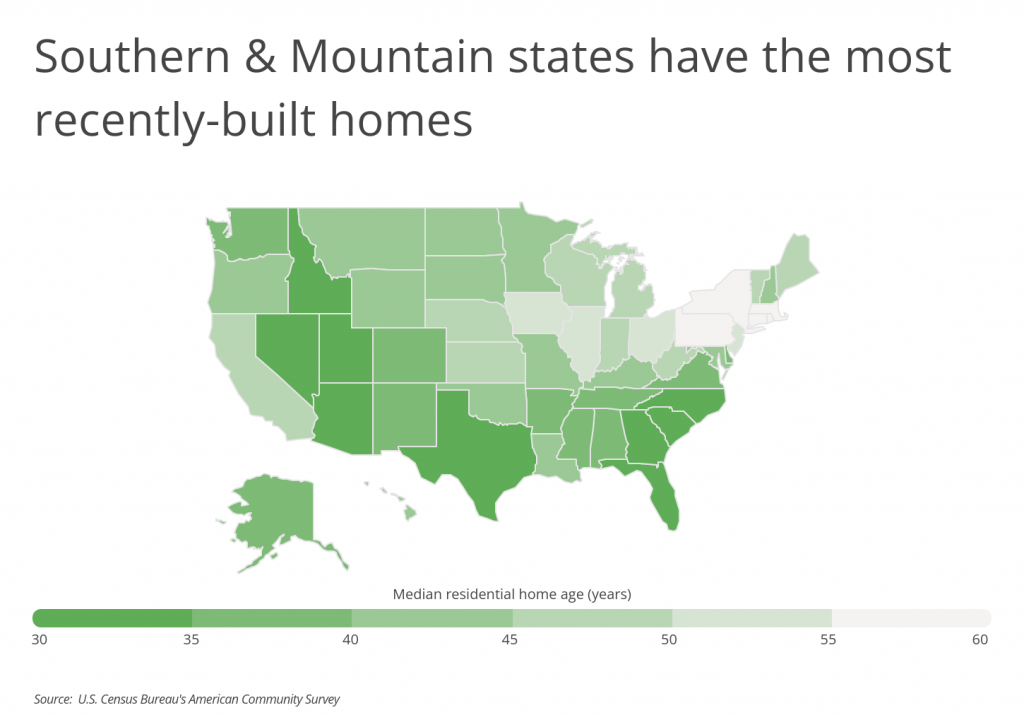
Parts of the Northeast and Midwest which have been heavily populated for longer tend to have older housing stock, according to data from the U.S. Census Bureau. New York leads the nation in residential home age with a median age of 63 years, followed by nearby Rhode Island and Massachusetts at 59 years. At the other end of the spectrum, states in the Mountain West and Southeast, which have been growing quickly in recent years, have younger housing stock overall. Nevada (26 years) leads all states with the newest housing, with states like Arizona, Utah, South Carolina, and Georgia not far behind.
Fast-growing Sun Belt cities offer the most recently-built housing at the metro level, and cities in two states stand out: North Carolina and Texas. North Carolina’s two largest metros, Raleigh and Charlotte, are each in the top three cities with the most new homes, while the Lone Star State is home to four of the top 15.
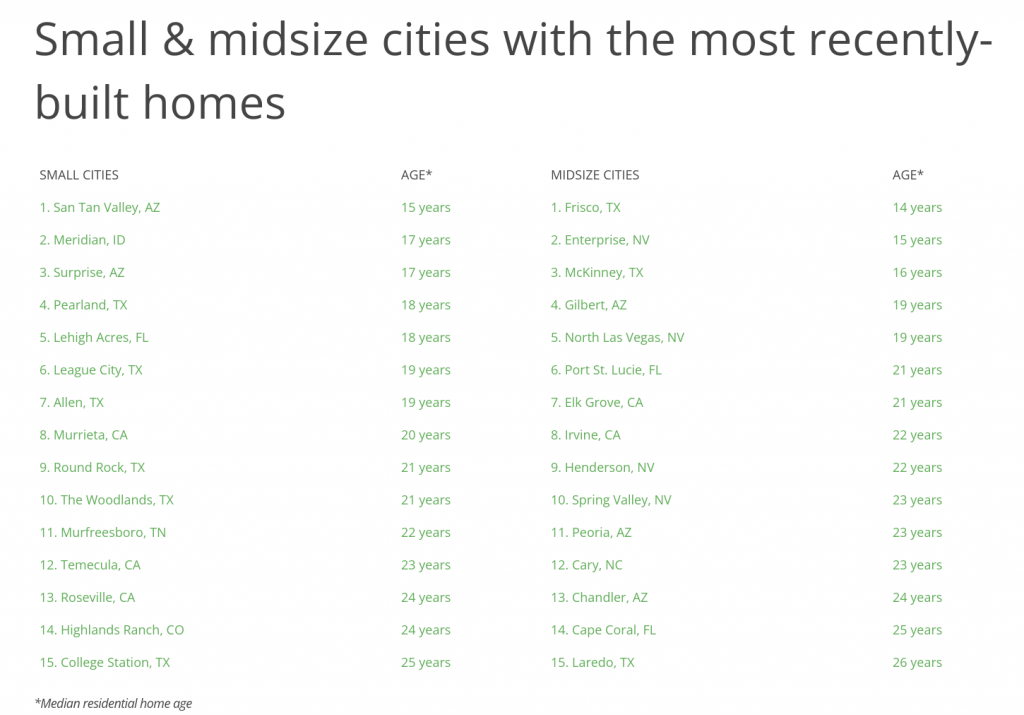
The data used in this analysis is from the U.S. Census Bureau’s American Community Survey (2020). To determine the locations with the most recently-built homes, researchers at Inspection Support Network calculated the median residential home age as of 2020, the most recent data available. Locations with lower home ages were ranked higher. In the event of a tie, the location with the greater share of housing units built in 2014 or later was ranked higher.
Here are the U.S. cities with the most recently-built homes.
Large Cities With the Most Recently-Built Homes

Photo Credit: Sean Pavone / Shutterstock
15. El Paso, TX
- Median residential home age: 38 years
- Share of housing units built in 2014 or later: 5.3%
- Total housing units built in 2014 or later: 13,291
- Change in population in the last 10 years: +8.1%

Photo Credit: Steve Heap / Shutterstock
14. Nashville-Davidson, TN
- Median residential home age: 38 years
- Share of housing units built in 2014 or later: 8.6%
- Total housing units built in 2014 or later: 26,713
- Change in population in the last 10 years: +13.5%
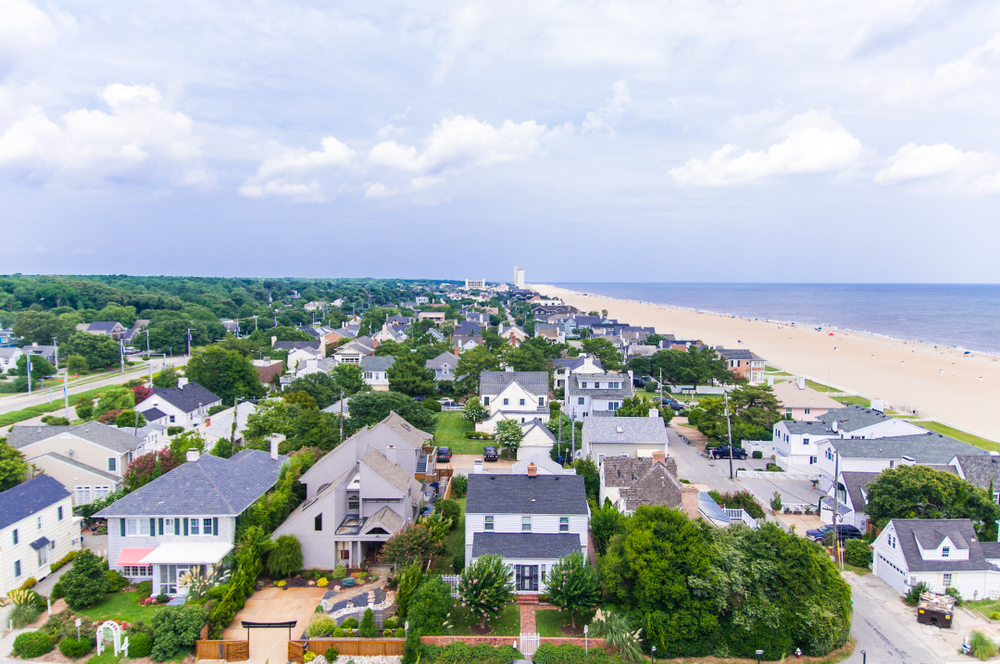
Photo Credit: John S. Quinn / Shutterstock
13. Virginia Beach, VA
- Median residential home age: 37 years
- Share of housing units built in 2014 or later: 2.9%
- Total housing units built in 2014 or later: 5,345
- Change in population in the last 10 years: +3.4%

Photo Credit: Gregory E. Clifford / Shutterstock
12. Phoenix, AZ
- Median residential home age: 37 years
- Share of housing units built in 2014 or later: 2.9%
- Total housing units built in 2014 or later: 18,482
- Change in population in the last 10 years: +14.4%

Photo Credit: Peter Witham / Shutterstock
11. Arlington, TX
- Median residential home age: 36 years
- Share of housing units built in 2014 or later: 1.7%
- Total housing units built in 2014 or later: 2,458
- Change in population in the last 10 years: +10.5%
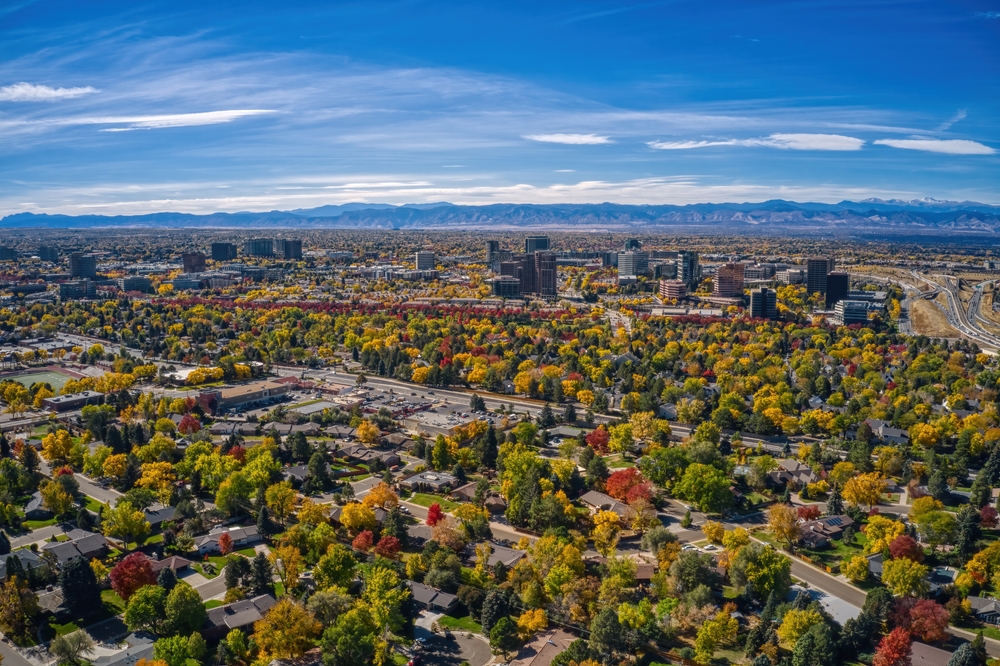
Photo Credit: Jacob Boomsma / Shutterstock
10. Aurora, CO
- Median residential home age: 36 years
- Share of housing units built in 2014 or later: 4.3%
- Total housing units built in 2014 or later: 5,917
- Change in population in the last 10 years: +20.8%

Photo Credit: photo.ua / Shutterstock
9. Colorado Springs, CO
- Median residential home age: 36 years
- Share of housing units built in 2014 or later: 4.6%
- Total housing units built in 2014 or later: 8,934
- Change in population in the last 10 years: +16.8%
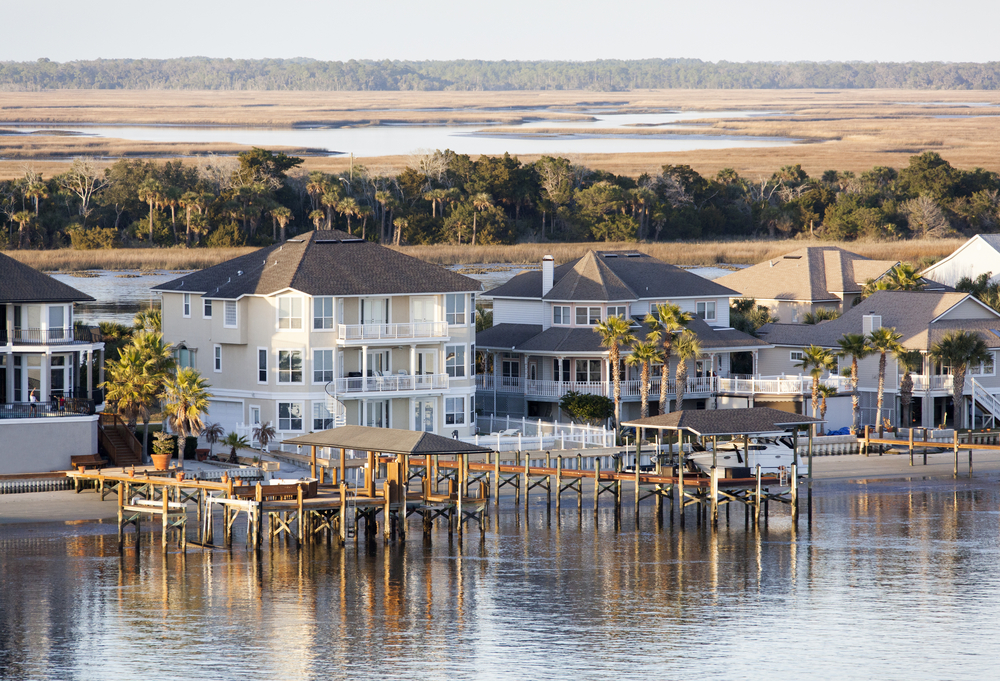
Photo Credit: Ramunas Bruzas / Shutterstock
8. Jacksonville, FL
- Median residential home age: 36 years
- Share of housing units built in 2014 or later: 4.6%
- Total housing units built in 2014 or later: 17,808
- Change in population in the last 10 years: +11.2%
Photo Credit: Tim Roberts Photography / Shutterstock
7. Mesa, AZ
- Median residential home age: 33 years
- Share of housing units built in 2014 or later: 4.9%
- Total housing units built in 2014 or later: 10,512
- Change in population in the last 10 years: +15.8%

Photo Credit: Matt Gush / Shutterstock
6. Bakersfield, CA
- Median residential home age: 32 years
- Share of housing units built in 2014 or later: 4.8%
- Total housing units built in 2014 or later: 6,051
- Change in population in the last 10 years: +14.5%

Photo Credit: Timothy Milan Kuret / Shutterstock
5. Fort Worth, TX
- Median residential home age: 32 years
- Share of housing units built in 2014 or later: 7.1%
- Total housing units built in 2014 or later: 24,050
- Change in population in the last 10 years: +26.5%

Photo Credit: Ryan Conine / Shutterstock
4. Austin, TX
- Median residential home age: 31 years
- Share of housing units built in 2014 or later: 9.0%
- Total housing units built in 2014 or later: 38,301
- Change in population in the last 10 years: +26.4%

Photo Credit: digidreamgrafix / Shutterstock
3. Charlotte, NC
- Median residential home age: 29 years
- Share of housing units built in 2014 or later: 6.8%
- Total housing units built in 2014 or later: 24,990
- Change in population in the last 10 years: +23.8%

Photo Credit: f11photo / Shutterstock
2. Las Vegas, NV
- Median residential home age: 27 years
- Share of housing units built in 2014 or later: 3.1%
- Total housing units built in 2014 or later: 7,964
- Change in population in the last 10 years: +11.2%

Photo Credit: Farid Sani / Shutterstock
1. Raleigh, NC
- Median residential home age: 27 years
- Share of housing units built in 2014 or later: 7.9%
- Total housing units built in 2014 or later: 16,237
- Change in population in the last 10 years: +22.7%
Detailed Findings & Methodology
The data used in this analysis is from the U.S. Census Bureau’s American Community Survey (2020). To determine the locations with the most recently-built homes, researchers at Inspection Support Network calculated the median residential home age as of 2020, the most recent data available. Locations with lower home ages were ranked higher. In the event of a tie, the location with the greater share of housing units built in 2014 or later was ranked higher. To improve relevance, only cities with at least 100,000 residents were included. Additionally, cities were grouped into cohorts based on population size: small (100,000–149,999), midsize (150,000–349,999), and large (350,000 or more).