
Photo Credit: fizkes / Shutterstock
Rising prices have been top of mind for most U.S. households since early 2021. Despite efforts by the Federal Reserve to tamp down inflation, year-over-year price increases remain stubbornly high. According to the most recent data from the Bureau of Labor Statistics, prices are 7.8% higher than a year ago, which is below June’s 40-year record of 9.0%, but still well above the target rate of 2%. One of the biggest drivers of price increases has been skyrocketing energy costs, which Americans have been feeling both at the gas pump and through higher utility bills.
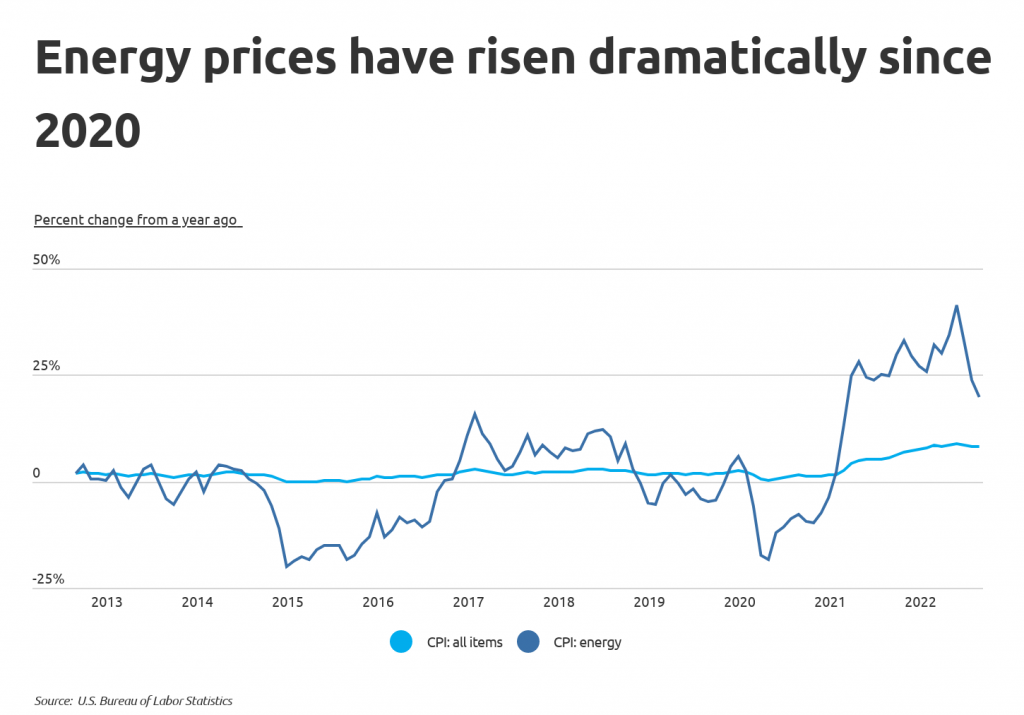
Energy prices have experienced some of the sharpest increases of any spending category. In June, when inflation hit a four-decade high, energy prices increased by a whopping 41.5% from the year prior. While energy price increases have moderated since then, they were still up nearly 18% in October. A surge in natural gas prices can explain much of the increase. Global demand for natural gas remains high, while the supply—much of which comes from Russia—has been cut.

According to the U.S. Census Bureau, the typical American household spends $245 per month on utilities, or 3.5% of their household income. At over 60%, electricity accounts for the largest share of monthly utility costs. Rising electricity prices have been largely driven by increased wholesale power prices due to higher natural gas prices. Half of American homes use natural gas—the next biggest spending category—for heating or cooling, and high natural gas prices are projected this coming winter as demand remains high.
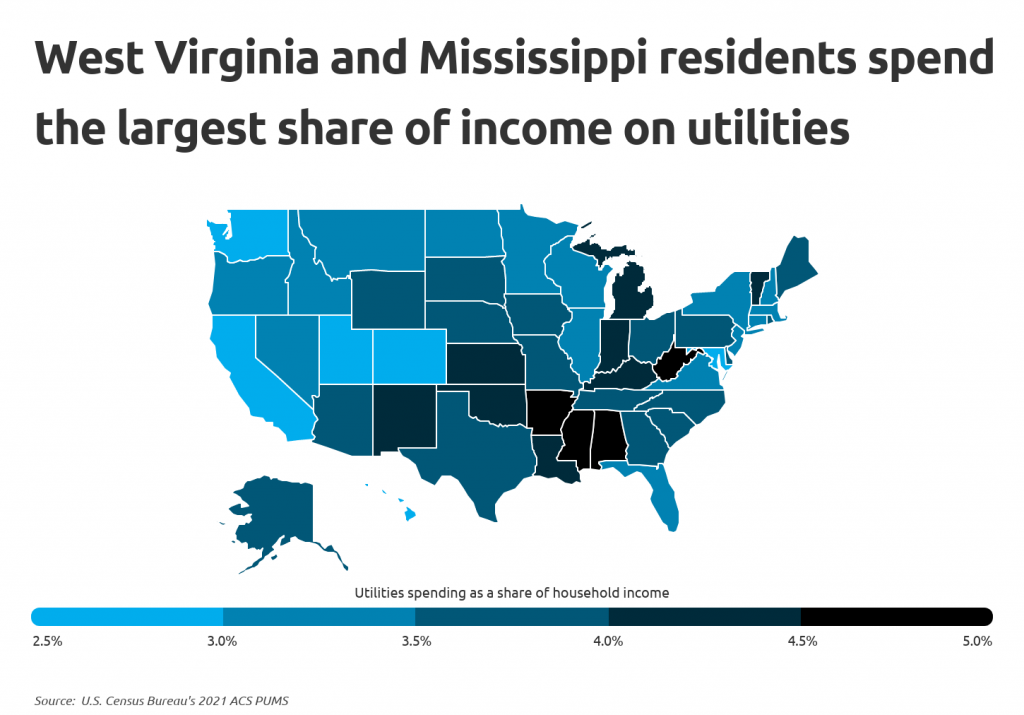
While the typical American household spends around $245 per month on utilities, utility spending varies significantly due to factors such as climate, energy prices, and household size. States in the Northeast spend the most overall, as a result of both cold winters and hot summers, but residents in the South spend the most relative to household income. At 4.9% and 4.8%, respectively, West Virginia and Mississippi households allocate the greatest share of income towards utilities. At the opposite end of the spectrum, a typical household in Maryland, Hawaii, Colorado, or Utah spends just 2.7% of their income on utilities.
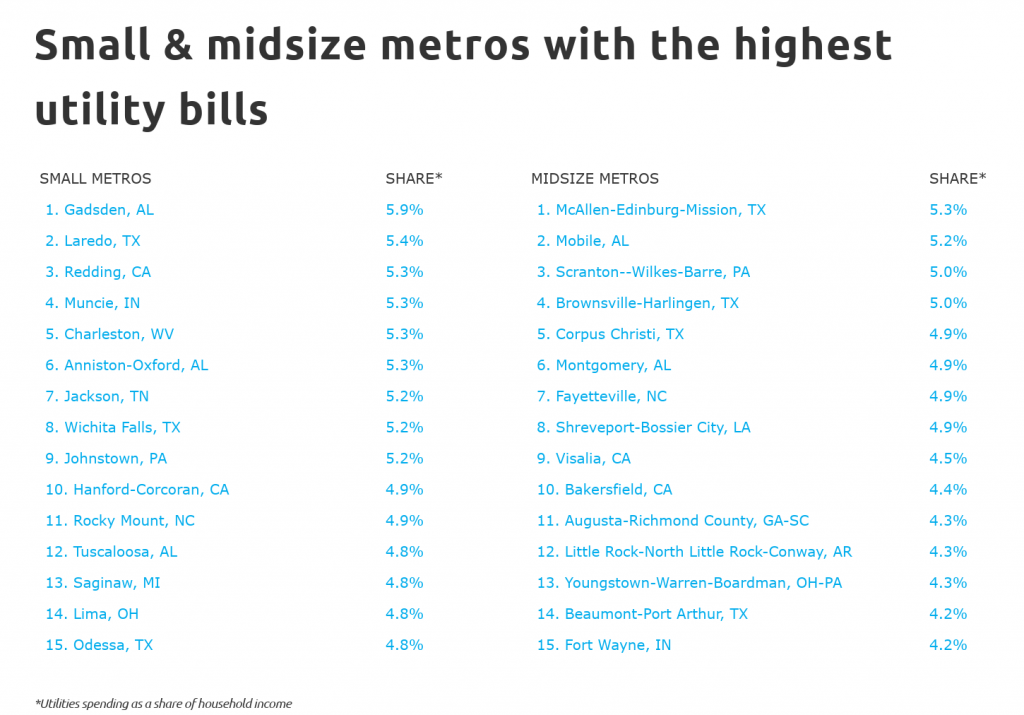
To determine the U.S. metropolitan areas with the highest utility bills, researchers on behalf of Self Financial analyzed the latest data from the U.S. Census Bureau. The researchers ranked metros according to median utilities spending as a share of household income. Researchers also calculated median monthly spending on electric, gas, sewer and water, and other fuels.
Here are the U.S. metropolitan areas with the highest utility bills.
Large Metros With the Highest Utility Bills

Photo Credit: f11photo / Shutterstock
15. Hartford-East Hartford-Middletown, CT
- Utilities spending as a share of household income: 3.4%
- Median monthly utilities spending: $294
- Median monthly electric spending: $150
- Median monthly gas spending: $100
- Median monthly sewer and water spending: $42
- Median monthly spending on other fuels: $100

Photo Credit: John S. Quinn / Shutterstock
14. Virginia Beach-Norfolk-Newport News, VA-NC
- Utilities spending as a share of household income: 3.5%
- Median monthly utilities spending: $273
- Median monthly electric spending: $150
- Median monthly gas spending: $70
- Median monthly sewer and water spending: $63
- Median monthly spending on other fuels: $42

Photo Credit: Sean Pavone / Shutterstock
13. Cleveland-Elyria, OH
- Utilities spending as a share of household income: 3.6%
- Median monthly utilities spending: $233
- Median monthly electric spending: $100
- Median monthly gas spending: $80
- Median monthly sewer and water spending: $50
- Median monthly spending on other fuels: $46

Photo Credit: Sean Pavone / Shutterstock
12. Indianapolis-Carmel-Anderson, IN
- Utilities spending as a share of household income: 3.6%
- Median monthly utilities spending: $250
- Median monthly electric spending: $140
- Median monthly gas spending: $80
- Median monthly sewer and water spending: $42
- Median monthly spending on other fuels: $40

Photo Credit: Tupungato / Shutterstock
11. Kansas City, MO-KS
- Utilities spending as a share of household income: 3.6%
- Median monthly utilities spending: $272
- Median monthly electric spending: $150
- Median monthly gas spending: $60
- Median monthly sewer and water spending: $50
- Median monthly spending on other fuels: $29

Photo Credit: Sean Pavone / Shutterstock
10. Providence-Warwick, RI-MA
- Utilities spending as a share of household income: 3.7%
- Median monthly utilities spending: $293
- Median monthly electric spending: $140
- Median monthly gas spending: $100
- Median monthly sewer and water spending: $50
- Median monthly spending on other fuels: $100

Photo Credit: Sean Pavone / Shutterstock
9. New Orleans-Metairie, LA
- Utilities spending as a share of household income: 3.8%
- Median monthly utilities spending: $235
- Median monthly electric spending: $150
- Median monthly gas spending: $50
- Median monthly sewer and water spending: $46
- Median monthly spending on other fuels: $17

Photo Credit: Sean Pavone / Shutterstock
8. Oklahoma City, OK
- Utilities spending as a share of household income: 3.8%
- Median monthly utilities spending: $236
- Median monthly electric spending: $130
- Median monthly gas spending: $60
- Median monthly sewer and water spending: $48
- Median monthly spending on other fuels: $25

Photo Credit: Ivan Cholakov / Shutterstock
7. Detroit-Warren-Dearborn, MI
- Utilities spending as a share of household income: 3.8%
- Median monthly utilities spending: $265
- Median monthly electric spending: $140
- Median monthly gas spending: $80
- Median monthly sewer and water spending: $55
- Median monthly spending on other fuels: $42

Photo Credit: Jacob Boomsma / Shutterstock
6. Tucson, AZ
- Utilities spending as a share of household income: 3.9%
- Median monthly utilities spending: $235
- Median monthly electric spending: $140
- Median monthly gas spending: $40
- Median monthly sewer and water spending: $51
- Median monthly spending on other fuels: $21

Photo Credit: AevanStock / Shutterstock
5. Pittsburgh, PA
- Utilities spending as a share of household income: 3.9%
- Median monthly utilities spending: $263
- Median monthly electric spending: $110
- Median monthly gas spending: $90
- Median monthly sewer and water spending: $60
- Median monthly spending on other fuels: $67

Photo Credit: Jacob_Boomsma / Shutterstock
4. Fresno, CA
- Utilities spending as a share of household income: 4.0%
- Median monthly utilities spending: $280
- Median monthly electric spending: $180
- Median monthly gas spending: $50
- Median monthly sewer and water spending: $77
- Median monthly spending on other fuels: $33

Photo Credit: Sean Pavone / Shutterstock
3. Louisville/Jefferson County, KY-IN
- Utilities spending as a share of household income: 4.1%
- Median monthly utilities spending: $267
- Median monthly electric spending: $160
- Median monthly gas spending: $80
- Median monthly sewer and water spending: $60
- Median monthly spending on other fuels: $21

Photo Credit: Sean Pavone / Shutterstock
2. Memphis, TN-MS-AR
- Utilities spending as a share of household income: 4.2%
- Median monthly utilities spending: $261
- Median monthly electric spending: $200
- Median monthly gas spending: $60
- Median monthly sewer and water spending: $21
- Median monthly spending on other fuels: $17

Photo Credit: Sean Pavone / Shutterstock
1. Birmingham-Hoover, AL
- Utilities spending as a share of household income: 4.5%
- Median monthly utilities spending: $284
- Median monthly electric spending: $180
- Median monthly gas spending: $60
- Median monthly sewer and water spending: $40
- Median monthly spending on other fuels: $25
Detailed Findings & Methodology
To determine the U.S. metropolitan areas with the highest utility bills, researchers on behalf of Self Financial analyzed the latest data from the U.S. Census Bureau’s 2021 American Community Survey Public Use Microdata Sample. The researchers ranked metros according to median utilities spending as a share of household income. In the event of a tie, the metro with higher median monthly utilities spending was ranked higher. Researchers also calculated median monthly electric spending, median monthly gas spending, median monthly sewer and water spending, and median monthly spending on other fuels.
To improve relevance, only metropolitan areas with at least 100,000 people were included in the analysis. Additionally, metro areas were grouped into the following cohorts based on population size:
- Small metros: 100,000–349,999
- Midsize metros: 350,000–999,999
- Large metros: more than 1,000,000