Photo Credit: GaudiLab / Shutterstock
Since its inception, the United States has been a majority White country, but it is increasingly becoming more ethnically and racially diverse. In fact, the White population is projected to lose its majority status by 2045. However, increased population diversity has not carried over into the government workforce: minority groups remain vastly underrepresented among government jobs. While the U.S. is often thought of as a melting pot, the reality is that minority groups continue to face significant barriers to accessing and advancing in government positions.
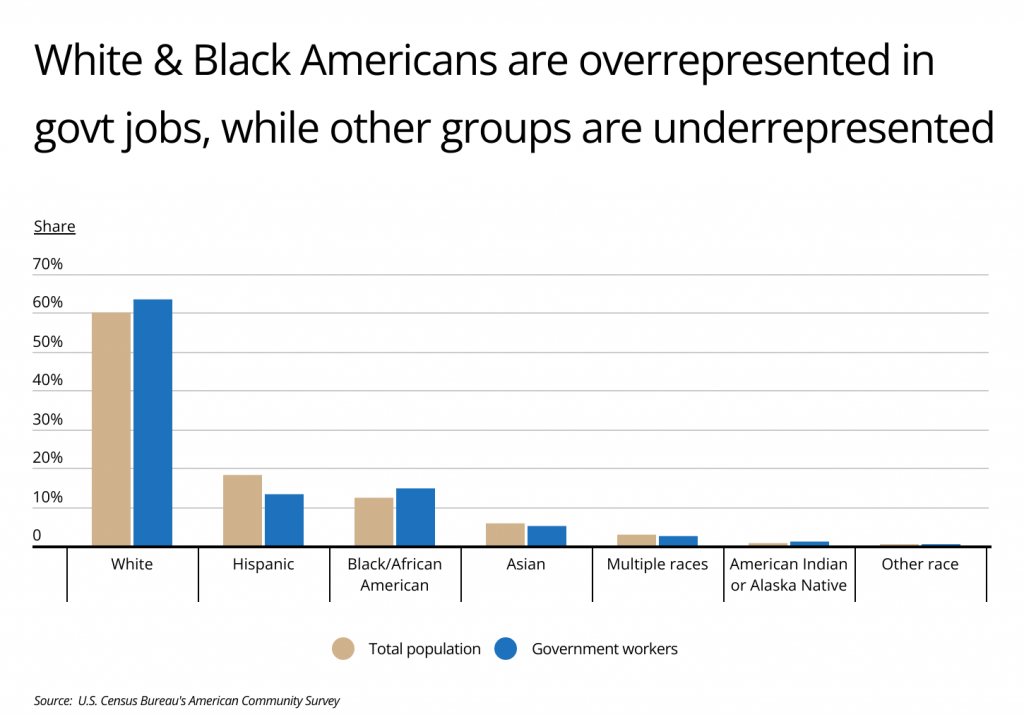
Non-White Americans make up nearly 40% of the population, but account for just 36.5% of government workers. While Black Americans are slightly overrepresented in government, other minority groups—particularly Hispanics—are significantly underrepresented. Hispanics make up 18.2% of the total population but only 13.2% of government workers.
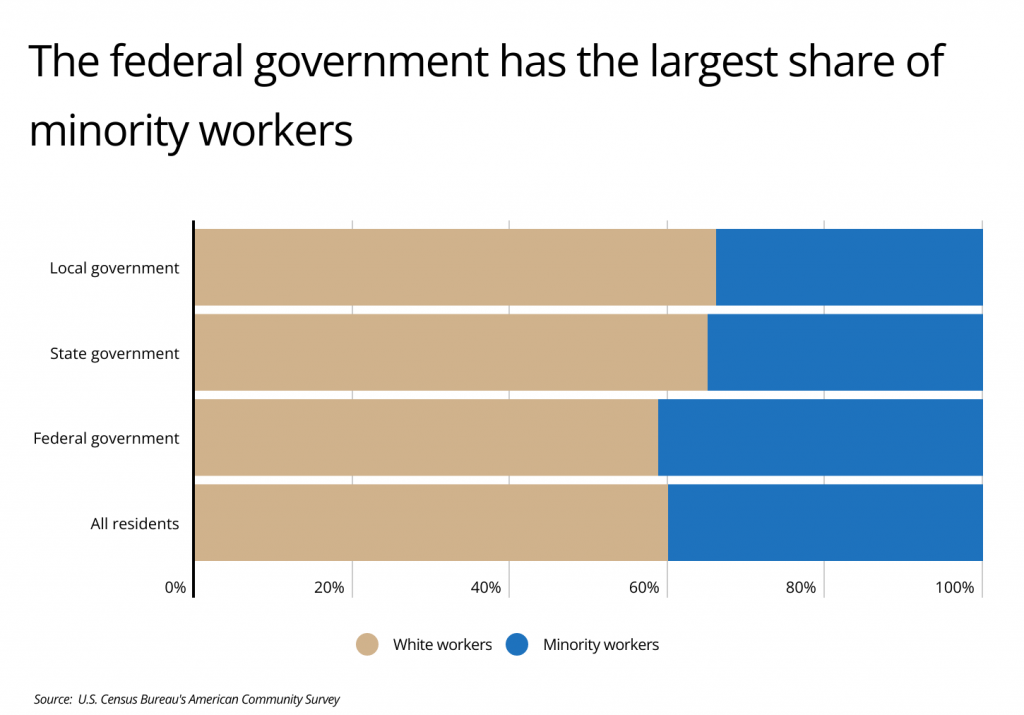
The diversity gap—defined as the percentage point difference between the share of minority workers in the overall population and in the government—differs by level of government. In fact, minority government workers are slightly overrepresented in the federal government, where minorities make up 41.3% of workers. At the local level, however, minority government workers account for just 33.9% of the workforce, meaning the diversity gap is six percentage points. At the state level, the government workforce is also less diverse, with a diversity gap of five percentage points.
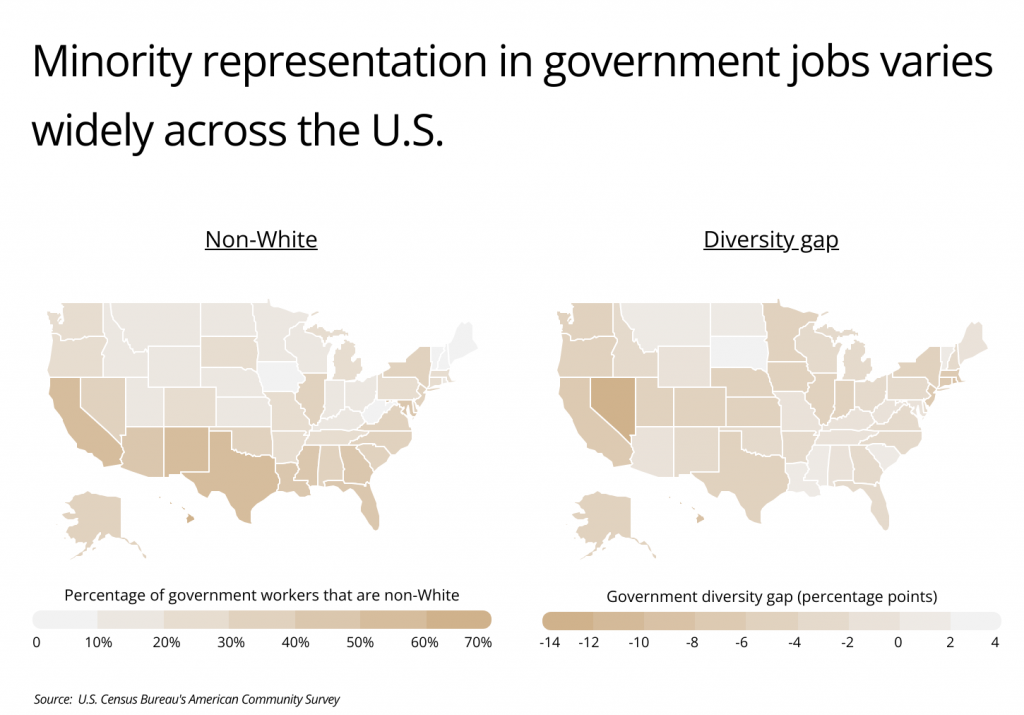
While minority representation in government jobs varies by race, ethnicity, and level of government, location is one of the most significant factors. The Southwest as well as parts of the Southeast and Northeast have the largest percentage of non-White government workers. The states with the greatest representation of minorities in government jobs are Hawaii and New Mexico, with 70.2% and 59.8% of government workers being non-White, respectively. On the other hand, the states with the least diverse government workforces are Maine, New Hampshire, and West Virginia, with only 6.2%, 7.7%, and 7.7% of government workers being non-White, respectively.
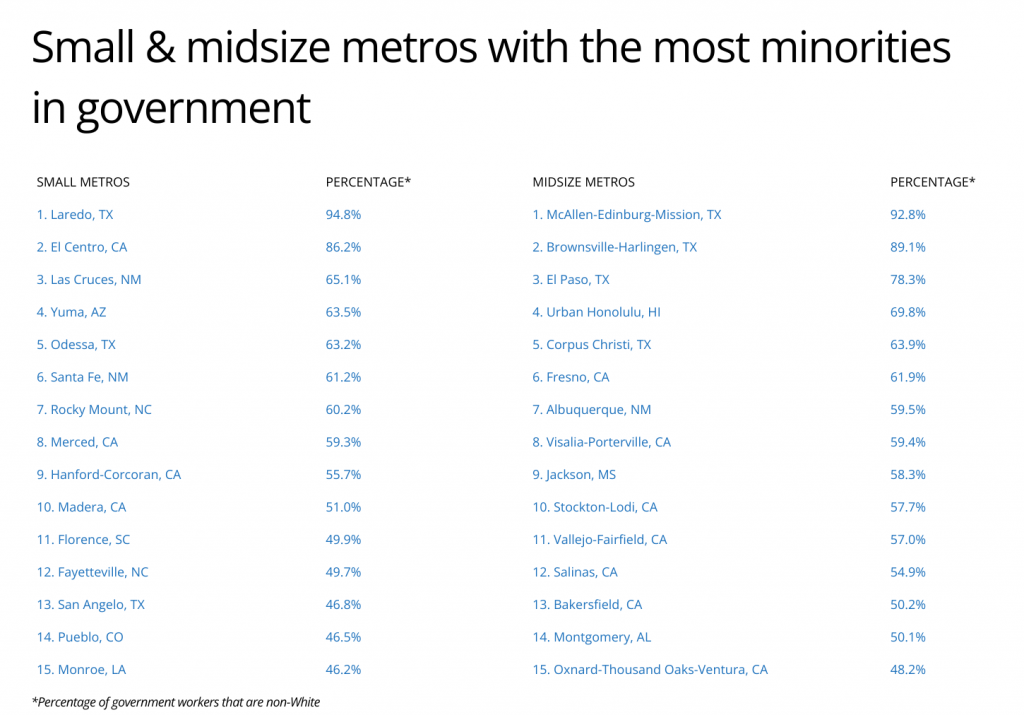
To determine the U.S. metropolitan areas with the most minorities in government, researchers at HomeandHamper.com analyzed the latest data from the U.S. Census Bureau. The researchers ranked metros according to the percentage of government workers that are non-White. Researchers also calculated the percentage of residents that are non-White, the government diversity gap—calculated as the difference in the percentage of government workers that are non-White and the percentage of residents that are non-White, the total number of non-White government workers, and the total number of non-White residents.
Here are the U.S. metropolitan areas with the most minorities in government.
Large Metros With the Most Minorities in Government
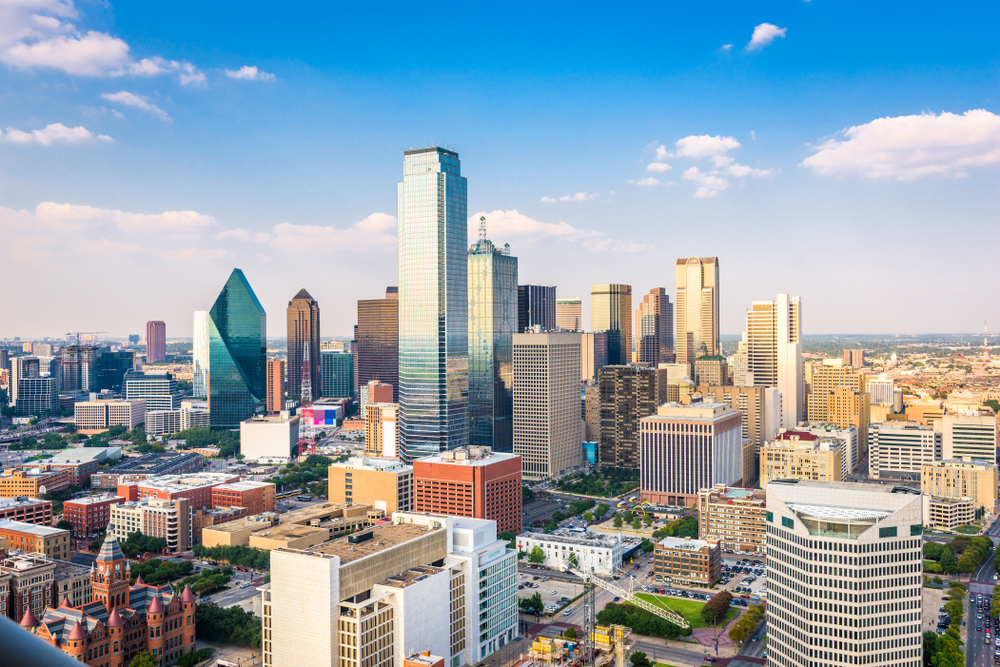
Photo Credit: Sean Pavone / Shutterstock
15. Dallas-Fort Worth-Arlington, TX
- Percentage of government workers that are non-White: 48.1%
- Percentage of residents that are non-White: 55.0%
- Government diversity gap (percentage points): -6.9
- Total non-White government workers: 186,007
- Total non-White residents: 4,060,536
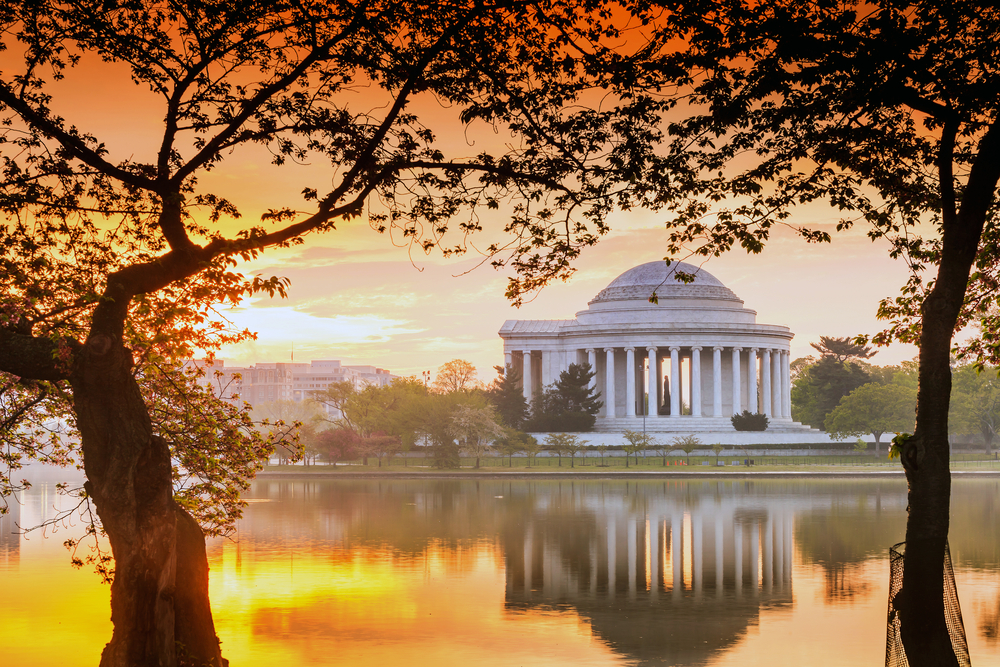
Photo Credit: f11photo / Shutterstock
14. Washington-Arlington-Alexandria, DC-VA-MD-WV
- Percentage of government workers that are non-White: 49.2%
- Percentage of residents that are non-White: 55.9%
- Government diversity gap (percentage points): -6.7
- Total non-White government workers: 387,964
- Total non-White residents: 3,430,370
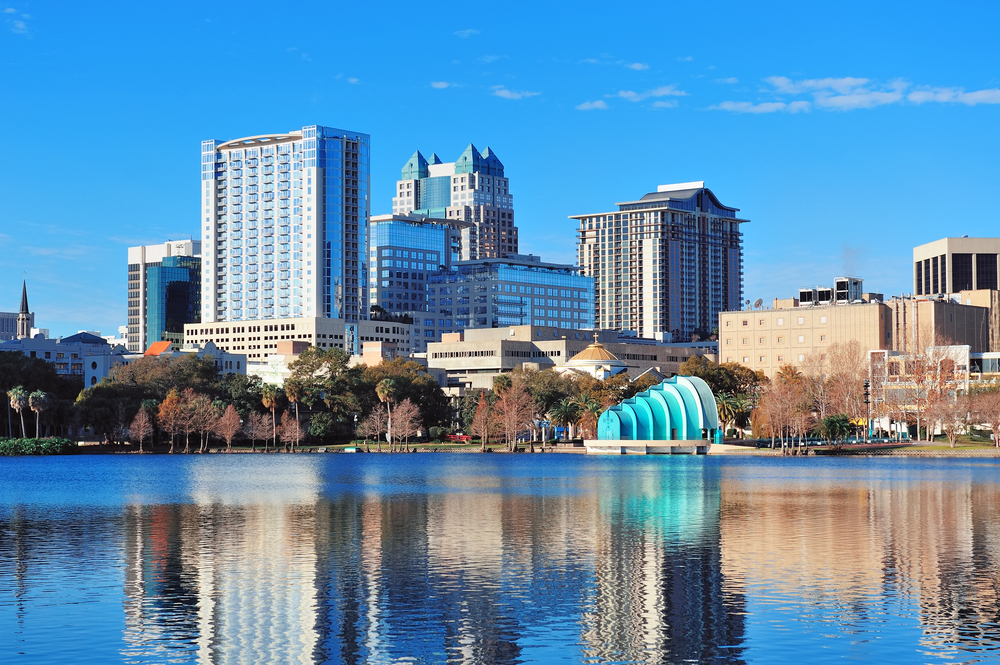
Photo Credit: Songquan Deng / Shutterstock
13. Orlando-Kissimmee-Sanford, FL
- Percentage of government workers that are non-White: 49.4%
- Percentage of residents that are non-White: 54.6%
- Government diversity gap (percentage points): -5.2
- Total non-White government workers: 62,824
- Total non-White residents: 1,374,687
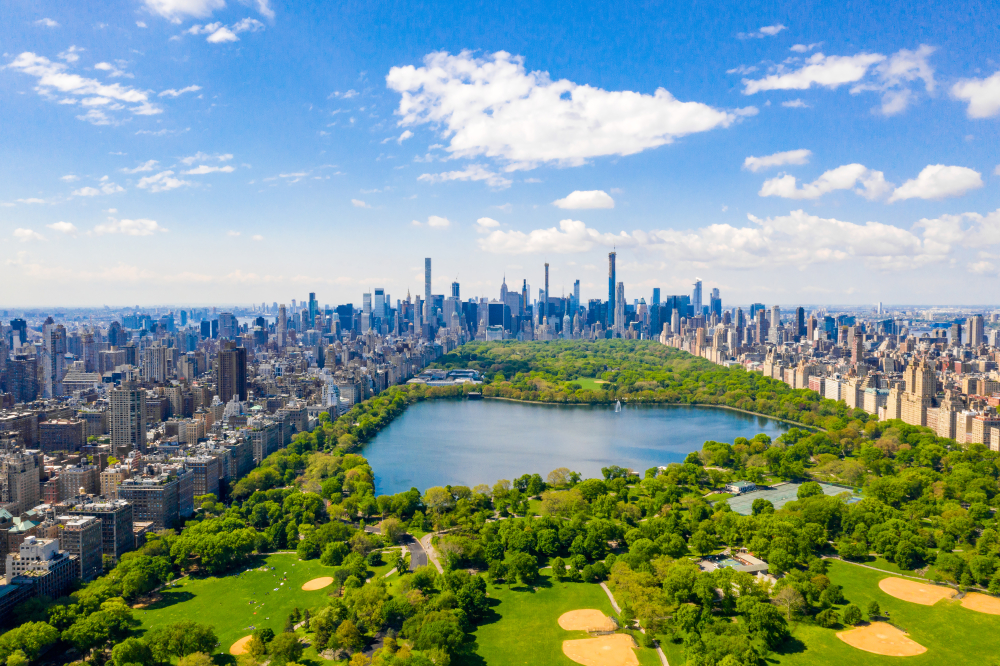
Photo Credit: Ingus Kruklitis / Shutterstock
12. New York-Newark-Jersey City, NY-NJ-PA
- Percentage of government workers that are non-White: 49.4%
- Percentage of residents that are non-White: 54.0%
- Government diversity gap (percentage points): -4.6
- Total non-White government workers: 682,020
- Total non-White residents: 10,725,956
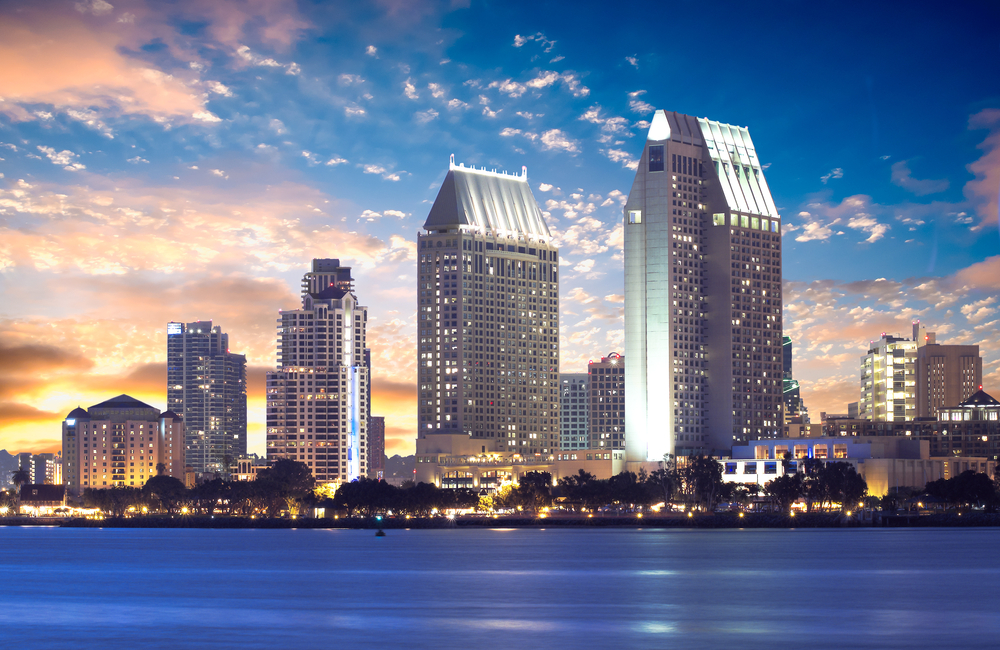
Photo Credit: Dancestrokes / Shutterstock
11. San Diego-Carlsbad, CA
- Percentage of government workers that are non-White: 50.3%
- Percentage of residents that are non-White: 55.1%
- Government diversity gap (percentage points): -4.8
- Total non-White government workers: 151,245
- Total non-White residents: 1,830,395

Photo Credit: Chuck Wagner / Shutterstock
10. New Orleans-Metairie, LA
- Percentage of government workers that are non-White: 50.7%
- Percentage of residents that are non-White: 48.8%
- Government diversity gap (percentage points): 1.9
- Total non-White government workers: 41,496
- Total non-White residents: 620,985
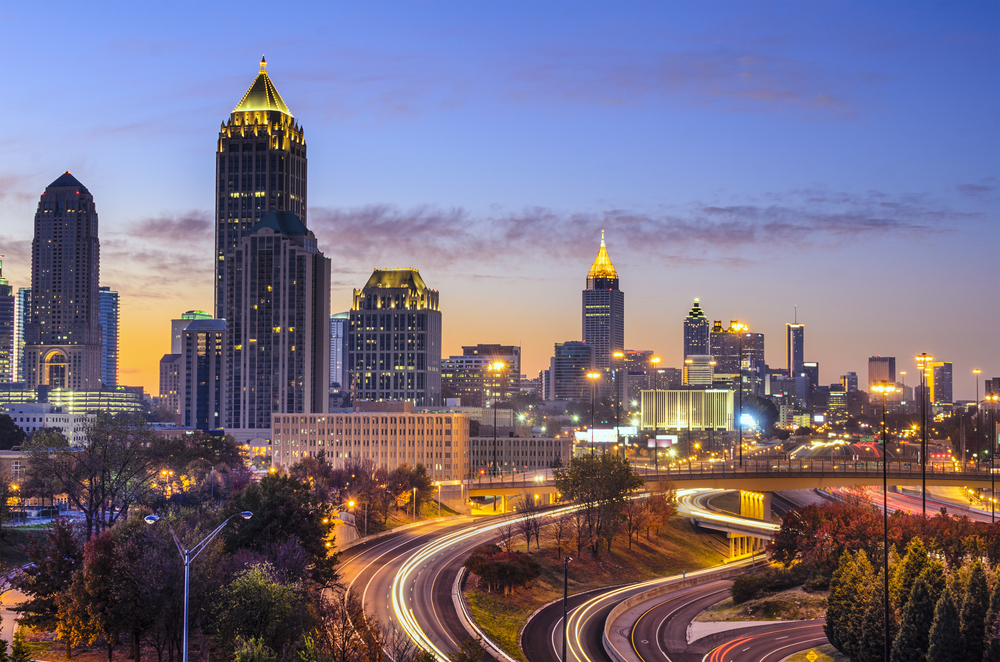
Photo Credit: ESB Professional / Shutterstock
9. Atlanta-Sandy Springs-Roswell, GA
- Percentage of government workers that are non-White: 53.5%
- Percentage of residents that are non-White: 54.0%
- Government diversity gap (percentage points): -0.5
- Total non-White government workers: 190,934
- Total non-White residents: 3,196,494
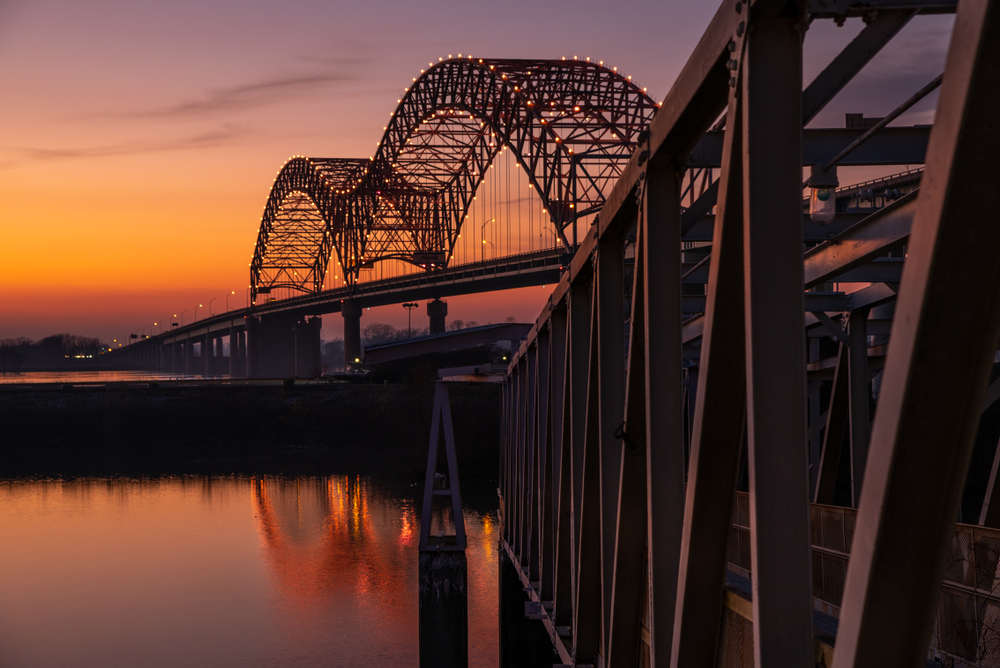
Photo Credit: The Speedy Butterfly / Shutterstock
8. Memphis, TN-MS-AR
- Percentage of government workers that are non-White: 58.0%
- Percentage of residents that are non-White: 57.2%
- Government diversity gap (percentage points): 0.8
- Total non-White government workers: 44,594
- Total non-White residents: 713,239
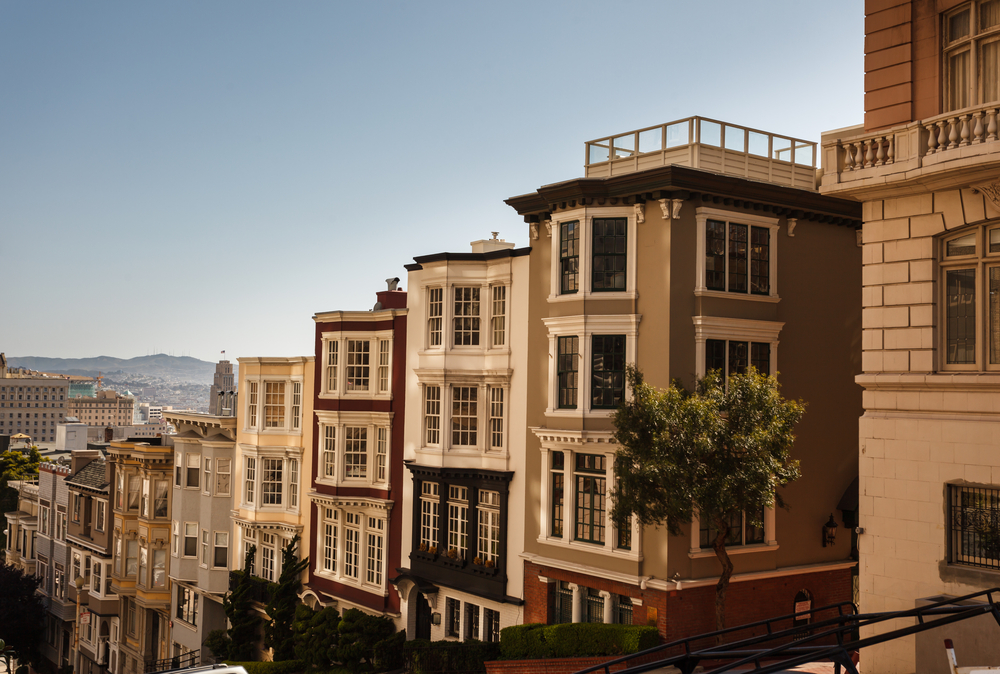
Photo Credit: Pete Niesen / Shutterstock
7. San Francisco-Oakland-Hayward, CA
- Percentage of government workers that are non-White: 59.5%
- Percentage of residents that are non-White: 61.2%
- Government diversity gap (percentage points): -1.7
- Total non-White government workers: 186,146
- Total non-White residents: 2,882,567

Photo Credit: travelview / Shutterstock
6. Houston-The Woodlands-Sugar Land, TX
- Percentage of government workers that are non-White: 60.2%
- Percentage of residents that are non-White: 64.7%
- Government diversity gap (percentage points): -4.5
- Total non-White government workers: 225,936
- Total non-White residents: 4,459,322
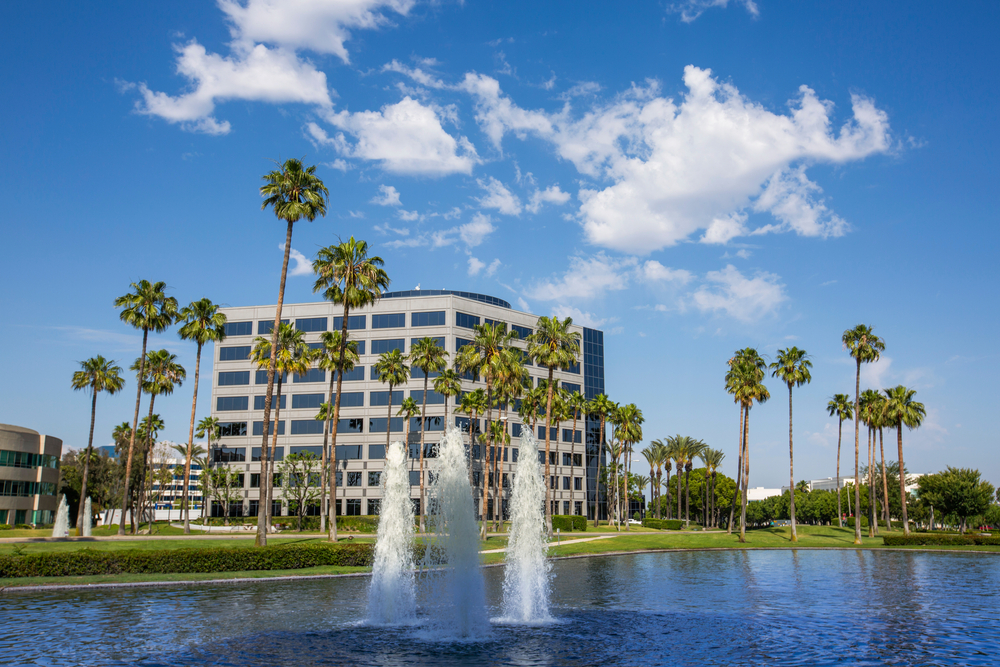
Photo Credit: Matt Gush / Shutterstock
5. Riverside-San Bernardino-Ontario, CA
- Percentage of government workers that are non-White: 61.3%
- Percentage of residents that are non-White: 68.8%
- Government diversity gap (percentage points): -7.5
- Total non-White government workers: 195,788
- Total non-White residents: 3,165,793
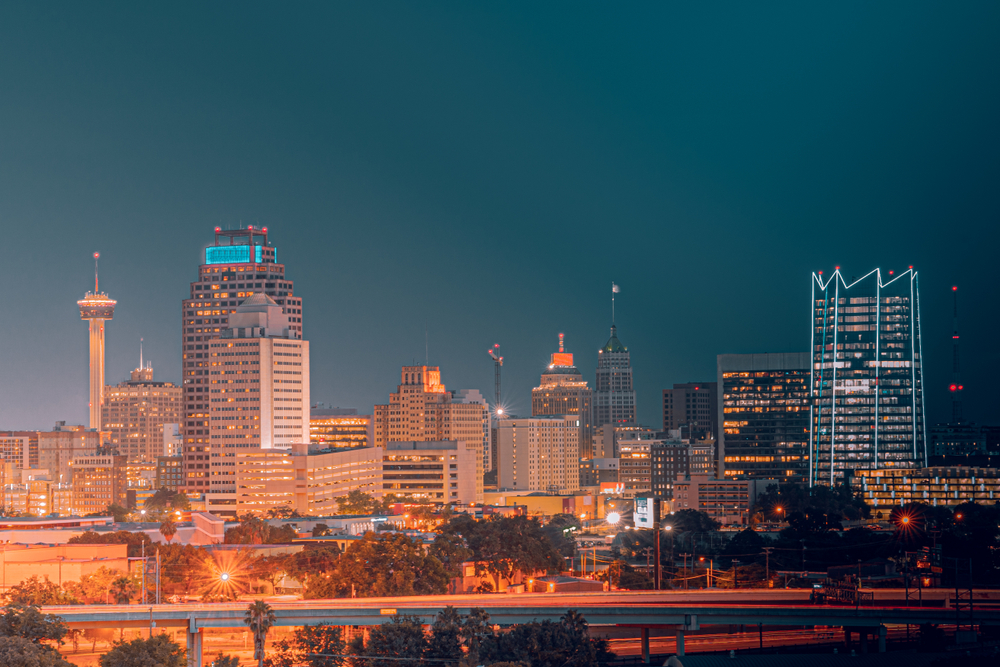
Photo Credit: Andrew Yoshiki / Shutterstock
4. San Antonio-New Braunfels, TX
- Percentage of government workers that are non-White: 63.4%
- Percentage of residents that are non-White: 68.2%
- Government diversity gap (percentage points): -4.8
- Total non-White government workers: 109,536
- Total non-White residents: 1,659,579
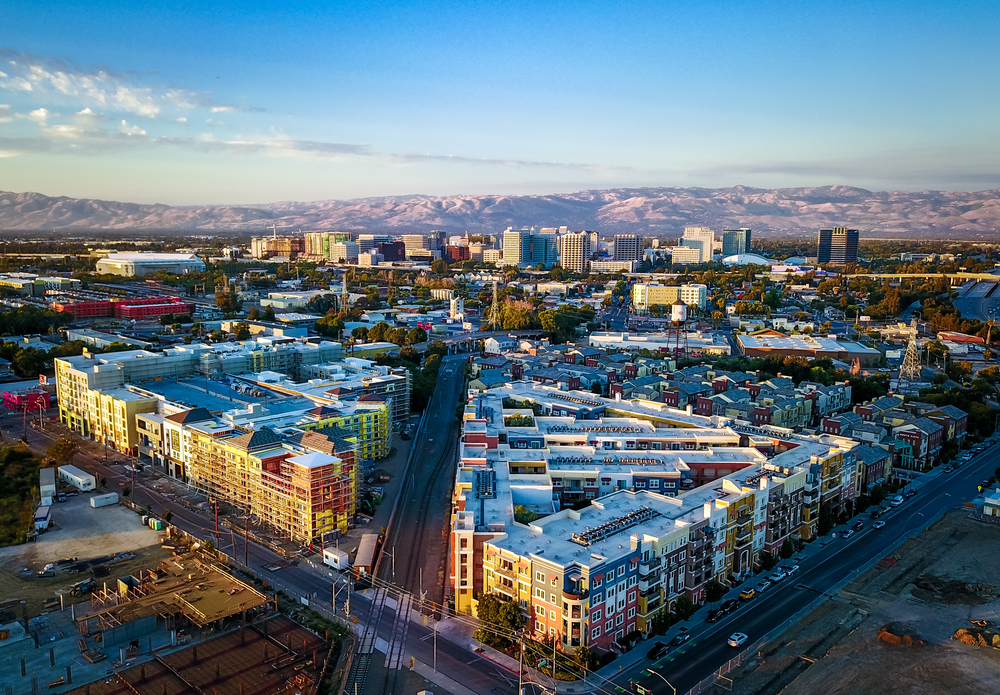
Photo Credit: Uladzik Kryhin / Shutterstock
3. San Jose-Sunnyvale-Santa Clara, CA
- Percentage of government workers that are non-White: 64.7%
- Percentage of residents that are non-White: 69.4%
- Government diversity gap (percentage points): -4.7
- Total non-White government workers: 61,984
- Total non-White residents: 1,334,656
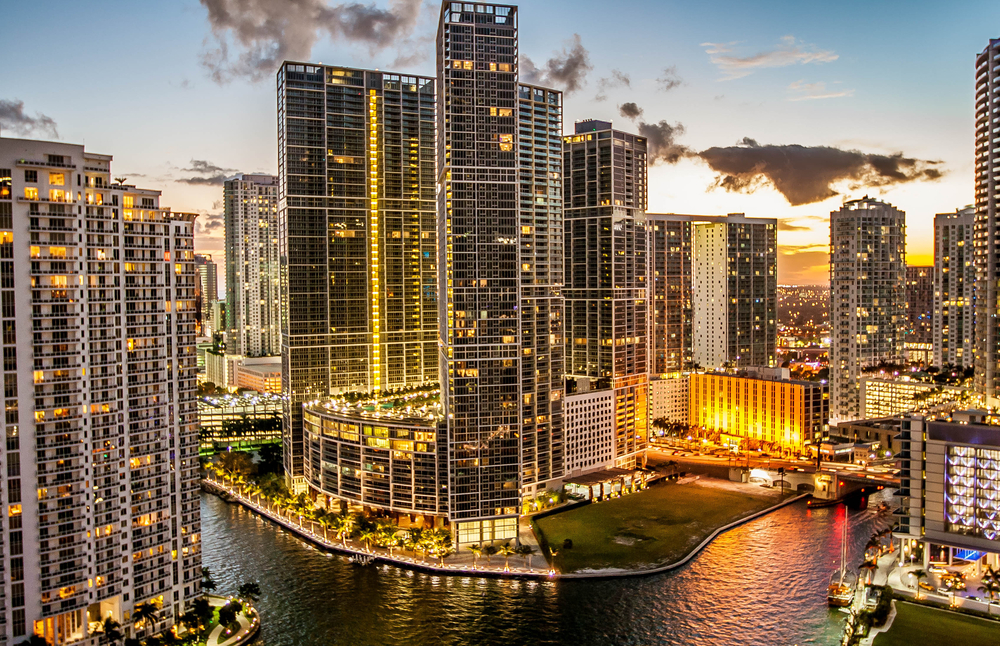
Photo Credit: dorinser / Shutterstock
2. Miami-Fort Lauderdale-West Palm Beach, FL
- Percentage of government workers that are non-White: 69.1%
- Percentage of residents that are non-White: 69.7%
- Government diversity gap (percentage points): -0.6
- Total non-White government workers: 204,367
- Total non-White residents: 4,248,344
Photo Credit: Chones / Shutterstock
1. Los Angeles-Long Beach-Anaheim, CA
- Percentage of government workers that are non-White: 69.3%
- Percentage of residents that are non-White: 70.7%
- Government diversity gap (percentage points): -1.4
- Total non-White government workers: 528,265
- Total non-White residents: 9,345,812
Detailed Findings & Methodology
To determine the U.S. metropolitan areas with the most minorities in government, researchers at HomeandHamper.com analyzed the latest data from the U.S. Census Bureau’s 2020 American Community Survey. The researchers ranked metros according to the percentage of government workers that are non-White. In the event of a tie, the metro with the larger number of non-White government workers was ranked higher. Researchers also calculated the percentage of residents that are non-White, the government diversity gap—calculated as the difference in the percentage of government workers that are non-White and the percentage of residents that are non-White, and the total number of non-White residents. In the analysis, White refers to people who are non-Hispanic White.
To improve relevance, only metropolitan areas with at least 100,000 people were included in the analysis. Additionally, metro areas were grouped into the following cohorts based on population size:
- Small metros: 100,000–349,999
- Midsize metros: 350,000–999,999
- Large metros: more than 1,000,000