
Photo Credit: fizkes / Shutterstock
Homeownership offers the opportunity to accumulate wealth and keep housing costs relatively consistent over time, both of which contribute to financial stability. However, homeownership benefits have not been experienced equally. Significant racial disparities in homeownership rates have persisted for decades, leading to large racial wealth gaps for some minority groups.
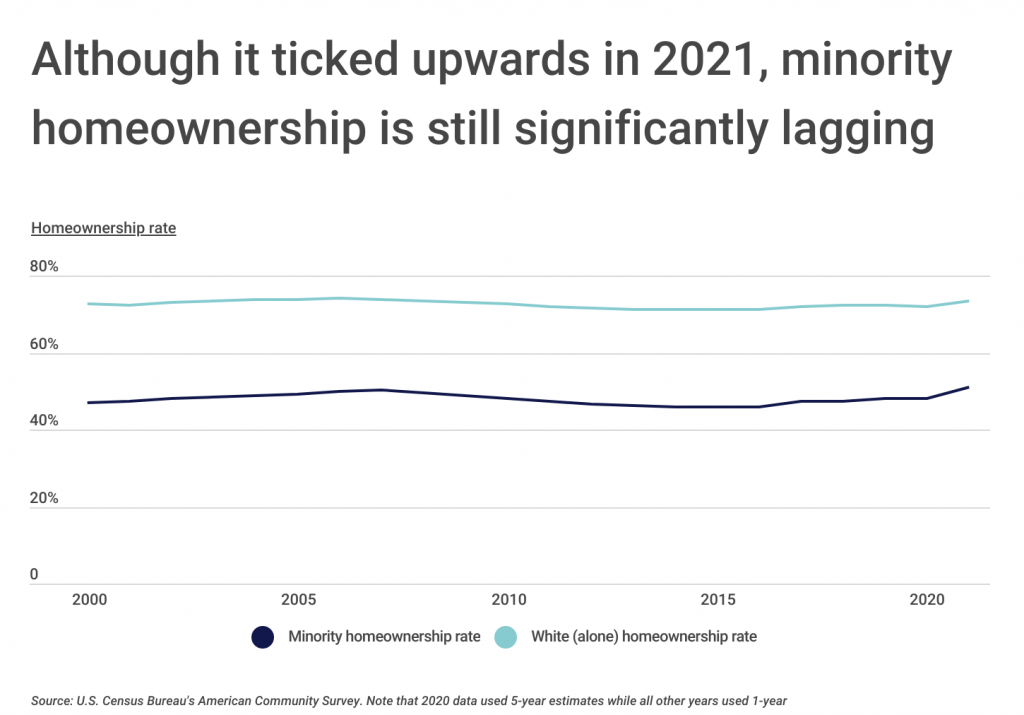
The minority homeownership gap, defined here as the difference between the White homeownership rate and the minority homeownership rate, hovered around 25 percentage points for years. In 2021, record low interest rates helped push the minority homeownership rate past 50% for the first time since 2007. The White homeownership rate ticked upwards as well, to over 73%. While the homeownership gap dropped slightly to 22.3% in 2021, minority homeownership continues to significantly lag behind that of White Americans.
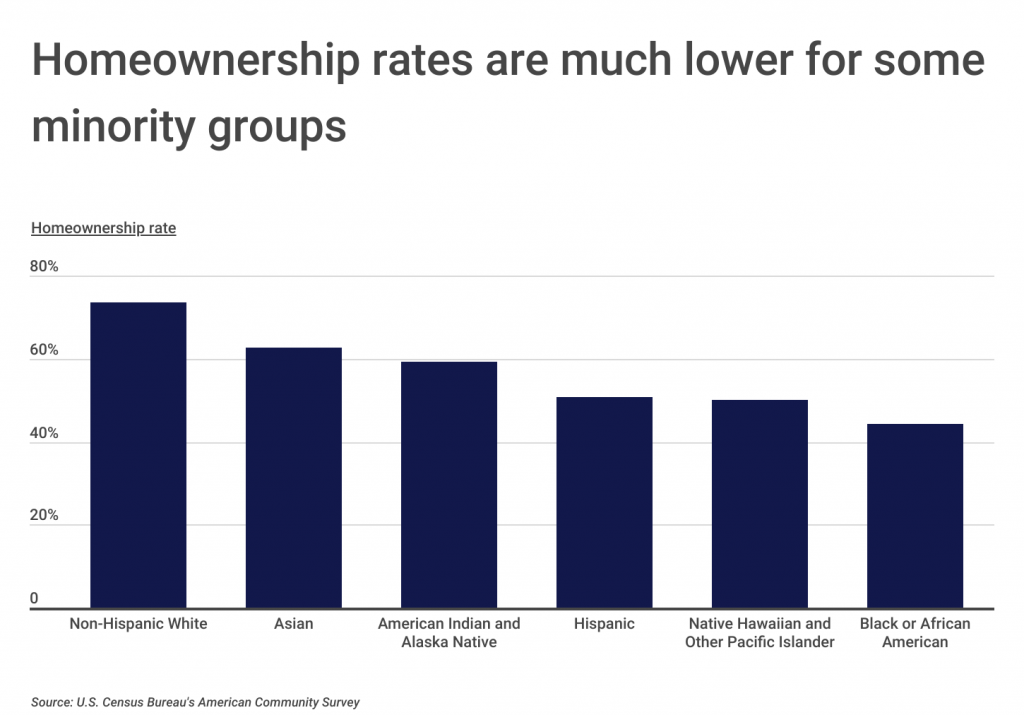
Although the overall minority homeownership rate is more than 22 percentage points lower than that of Whites, minority homeownership varies by race and ethnicity. Among minority groups, Asians have the highest rate of homeownership at 62.8%. Black or African Americans have the lowest homeownership rate, at just 44.3%.
The homeownership gap between Blacks and Whites has actually widened since the 1960s, when it was legal to refuse to sell a home to someone because of their race. Blacks were hit harder than other groups by the housing crisis in 2008, because they more frequently bought homes at the height of the bubble and were disproportionately the victims of subprime loan lenders. As a result, Black homeownership fell substantially, and the homeownership gap grew.
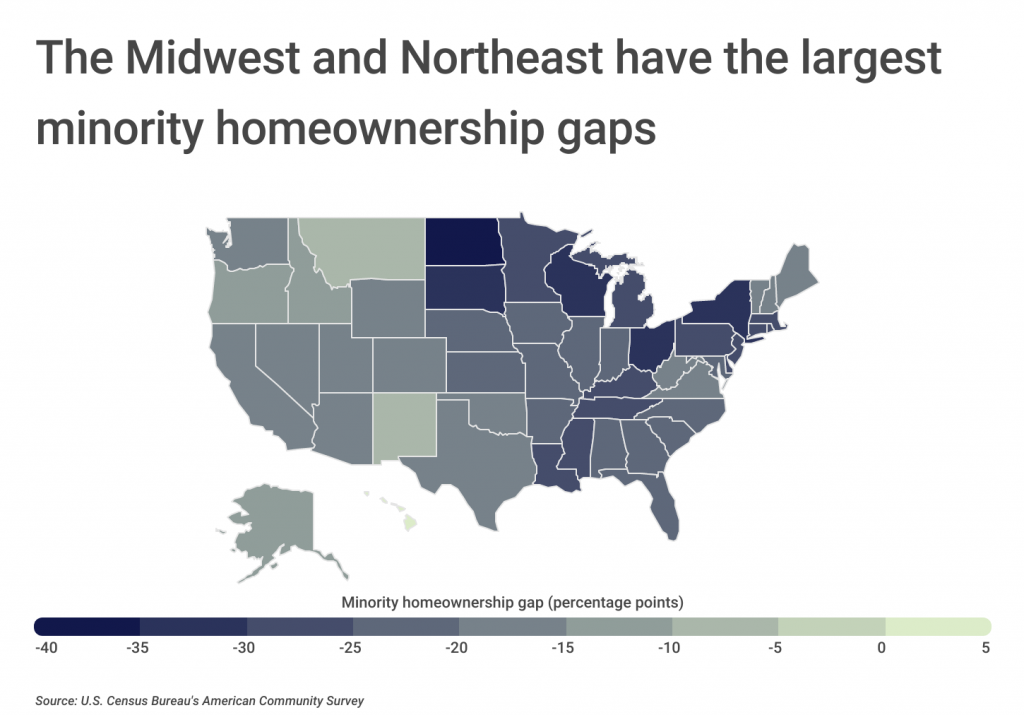
The minority homeownership gap varies across the U.S. due to factors such as local demographic makeup and historical homeownership rates. On a regional basis, the minority homeownership gap is largest in the Midwest and Northeast. The Dakotas have the largest minority homeownership gaps in the country, with North Dakota at 35.9 percentage points and South Dakota at 33.2. In Hawaii, the minority homeownership gap is actually positive, with the non-White homeownership rate 3.4 percentage points higher than the White homeownership rate.
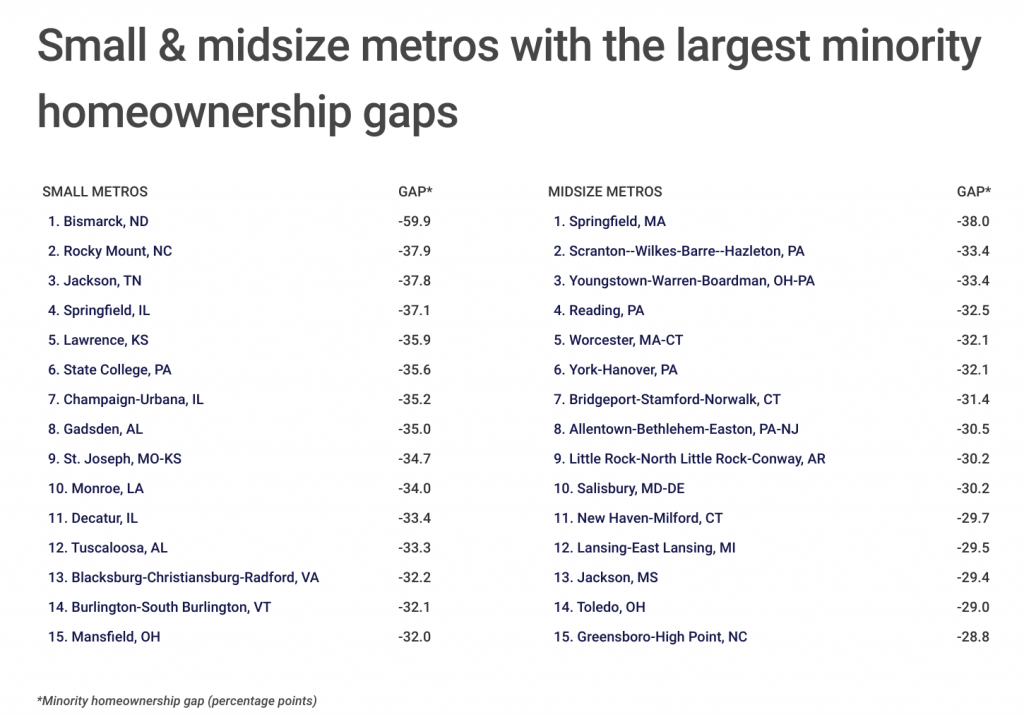
To determine the locations with the largest minority homeownership gaps, researchers at Construction Coverage analyzed the latest data from the U.S. Census Bureau. The researchers ranked metros according to the minority homeownership gap, defined as the percentage point difference in homeownership rates between Whites and minorities. Researchers also calculated the minority median property value and the White median property value. Minorities are people who are not non-Hispanic White.
Here are the U.S. metropolitan areas with the largest minority homeownership gaps.
Large Metros With the Largest Minority Homeownership Gaps
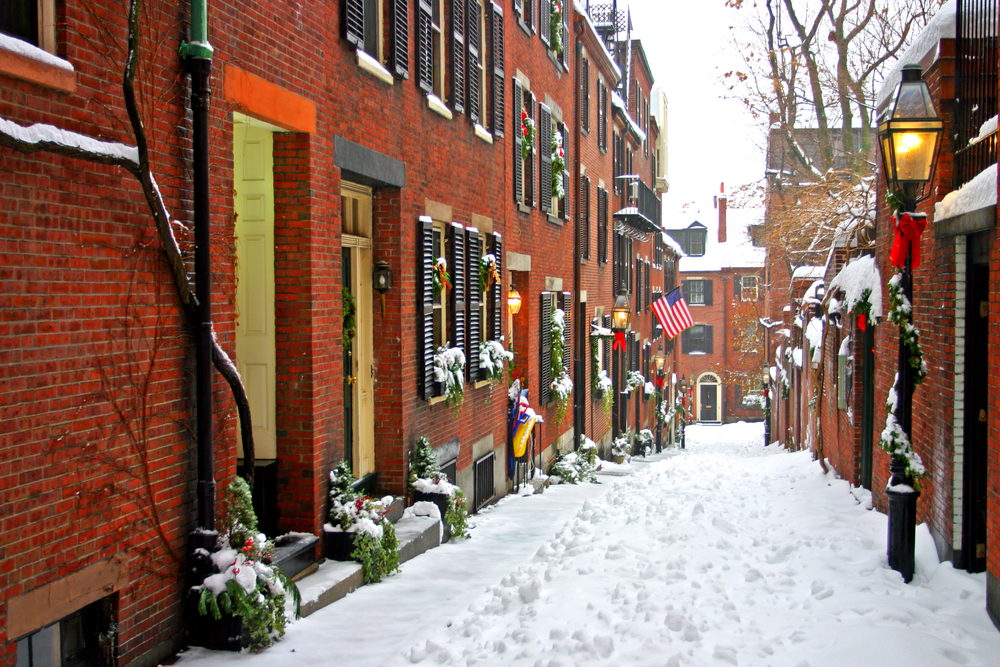
Photo Credit: CO Leong / Shutterstock
15. Boston-Cambridge-Newton, MA-NH
- Minority homeownership gap (percentage points): -27.4
- Minority homeownership rate: 42.7%
- White homeownership rate: 70.2%
- Minority median property value: $532,000
- White median property value: $505,000

Photo Credit: Concrete Jungle Media / Shutterstock
14. Detroit-Warren-Dearborn, MI
- Minority homeownership gap (percentage points): -27.9
- Minority homeownership rate: 52.7%
- White homeownership rate: 80.5%
- Minority median property value: $150,000
- White median property value: $232,000

Photo Credit: Jon Bilous / Shutterstock
13. Hartford-West Hartford-East Hartford, CT
- Minority homeownership gap (percentage points): -28.7
- Minority homeownership rate: 48.2%
- White homeownership rate: 76.9%
- Minority median property value: $240,000
- White median property value: $280,000
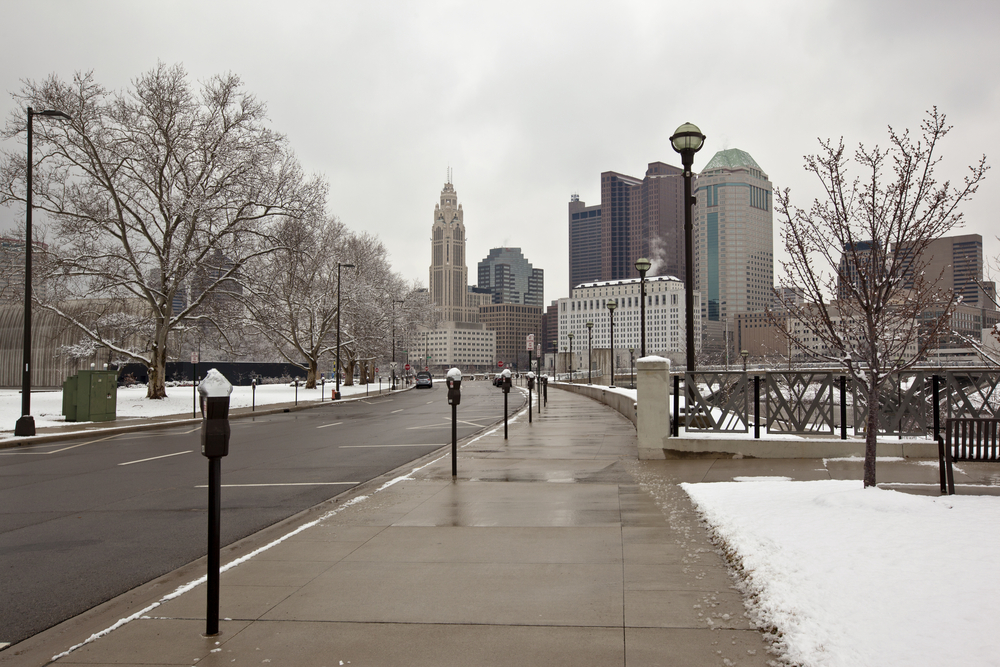
Photo Credit: aceshot1 / Shutterstock
12. Columbus, OH
- Minority homeownership gap (percentage points): -28.7
- Minority homeownership rate: 40.3%
- White homeownership rate: 69.0%
- Minority median property value: $220,000
- White median property value: $250,000

Photo Credit: Jason Sponseller / Shutterstock
11. Pittsburgh, PA
- Minority homeownership gap (percentage points): -28.8
- Minority homeownership rate: 46.5%
- White homeownership rate: 75.3%
- Minority median property value: $175,000
- White median property value: $190,000

Photo Credit: Richard Cavalleri / Shutterstock
10. Providence-Warwick, RI-MA
- Minority homeownership gap (percentage points): -28.8
- Minority homeownership rate: 40.8%
- White homeownership rate: 69.6%
- Minority median property value: $310,000
- White median property value: $350,000

Photo Credit: Stefan Ugljevarevic / Shutterstock
9. New York-Newark-Jersey City, NY-NJ-PA
- Minority homeownership gap (percentage points): -29.0
- Minority homeownership rate: 38.8%
- White homeownership rate: 67.8%
- Minority median property value: $500,000
- White median property value: $500,000

Photo Credit: f11photo / Shutterstock
8. St. Louis, MO-IL
- Minority homeownership gap (percentage points): -29.3
- Minority homeownership rate: 49.5%
- White homeownership rate: 78.9%
- Minority median property value: $160,000
- White median property value: $210,000

Photo Credit: Harold Stiver / Shutterstock
7. Louisville/Jefferson County, KY-IN
- Minority homeownership gap (percentage points): -30.9
- Minority homeownership rate: 45.2%
- White homeownership rate: 76.1%
- Minority median property value: $180,000
- White median property value: $215,000

Photo Credit: Rudy Balasko / Shutterstock
6. Cincinnati, OH-KY-IN
- Minority homeownership gap (percentage points): -30.9
- Minority homeownership rate: 43.8%
- White homeownership rate: 74.7%
- Minority median property value: $180,000
- White median property value: $210,000

Photo Credit: Sean Pavone / Shutterstock
5. Memphis, TN-MS-AR
- Minority homeownership gap (percentage points): -31.1
- Minority homeownership rate: 47.4%
- White homeownership rate: 78.6%
- Minority median property value: $150,000
- White median property value: $250,000
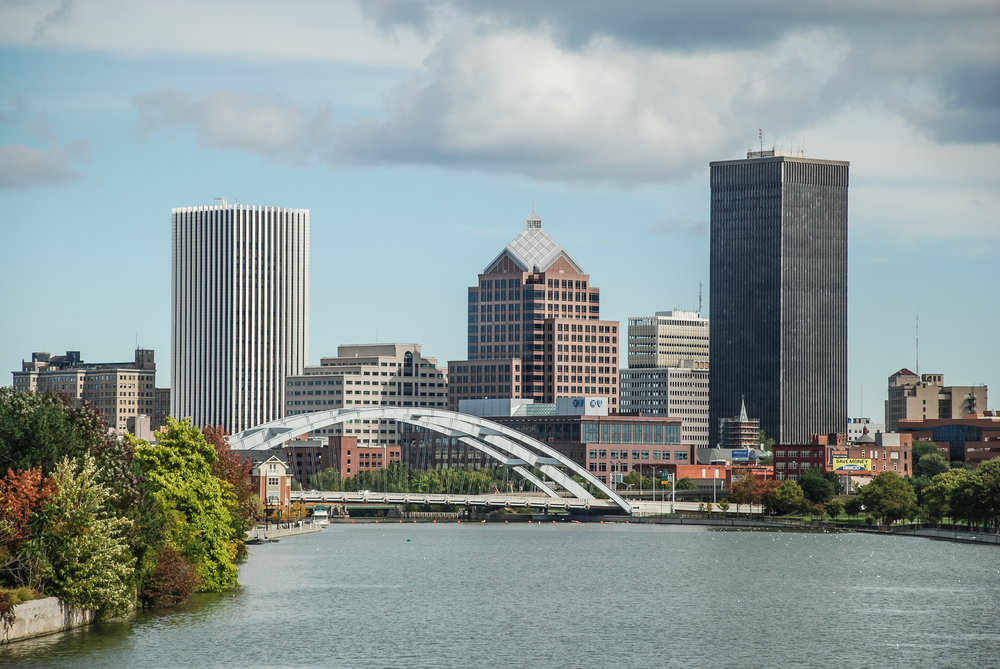
Photo Credit: TarnPisessith / Shutterstock
4. Rochester, NY
- Minority homeownership gap (percentage points): -31.7
- Minority homeownership rate: 43.3%
- White homeownership rate: 75.0%
- Minority median property value: $150,000
- White median property value: $175,000

Photo Credit: Sergey Novikov / Shutterstock
3. Buffalo-Cheektowaga-Niagara Falls, NY
- Minority homeownership gap (percentage points): -32.0
- Minority homeownership rate: 42.2%
- White homeownership rate: 74.2%
- Minority median property value: $150,000
- White median property value: $195,000

Photo Credit: f11photo / Shutterstock
2. Milwaukee-Waukesha-West Allis, WI
- Minority homeownership gap (percentage points): -32.2
- Minority homeownership rate: 38.8%
- White homeownership rate: 71.0%
- Minority median property value: $170,000
- White median property value: $280,000

Photo Credit: Kenneth Sponsler / Shutterstock
1. Cleveland-Elyria, OH
- Minority homeownership gap (percentage points): -34.7
- Minority homeownership rate: 41.4%
- White homeownership rate: 76.0%
- Minority median property value: $130,000
- White median property value: $200,000
Detailed Findings & Methodology
To determine the locations with the largest minority homeownership gap, researchers at Construction Coverage analyzed the latest data from the U.S. Census Bureau’s 2021 American Community Survey. The researchers ranked metros according to the minority homeownership gap, defined as the percentage point difference in homeownership rates between Whites and minorities. In the event of a tie, the metro with the smaller minority homeownership rate was ranked higher. Researchers also calculated the minority median property value and the White median property value. For the purposes of this analysis, minorities are people who are not non-Hispanic White. Additionally, minority homeownership gaps may not equal the sum of their components due to rounding error.
To improve relevance, only metropolitan areas with at least 100,000 people were included in the analysis. Additionally, metro areas were grouped into the following cohorts based on population size:
- Small metros: 100,000–349,999
- Midsize metros: 350,000–999,999
- Large metros: more than 1,000,000