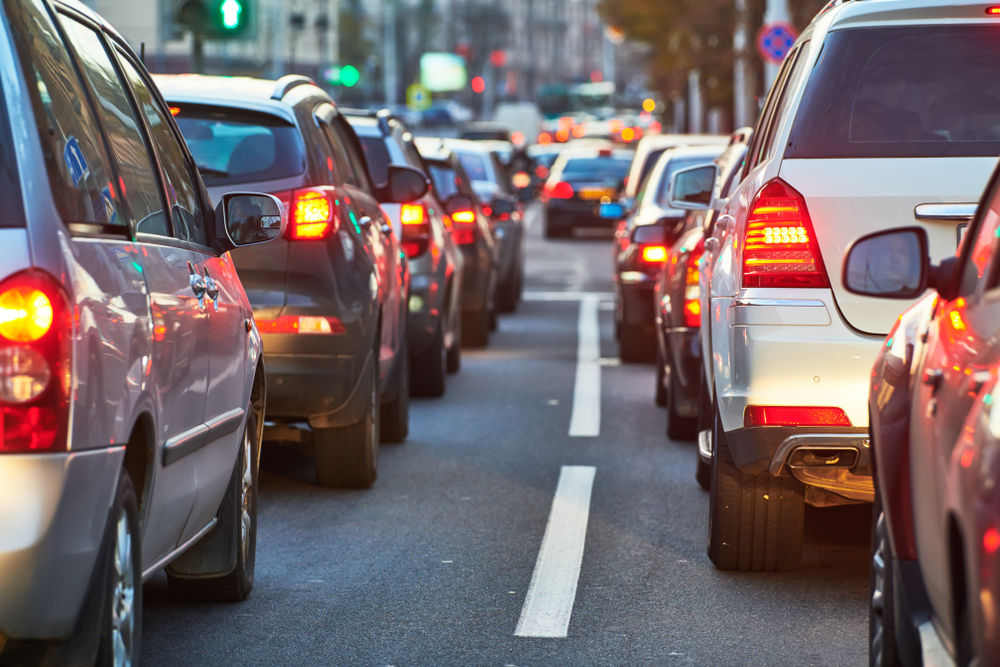
Photo Credit: Dmitry Kalinovsky / Shutterstock
One of the few, albeit temporary, benefits of the COVID-19 pandemic was the dramatic reduction in vehicle traffic. Stay-at-home orders, school closures, and working from home kept people at home and cars off the road. As workers returned to the office and businesses resumed their normal operations, traffic congestion started to rebound but is still well below pre-pandemic levels. Because long commute times and traffic can have a significant impact on personal well-being, they often play a major role when choosing where to live.
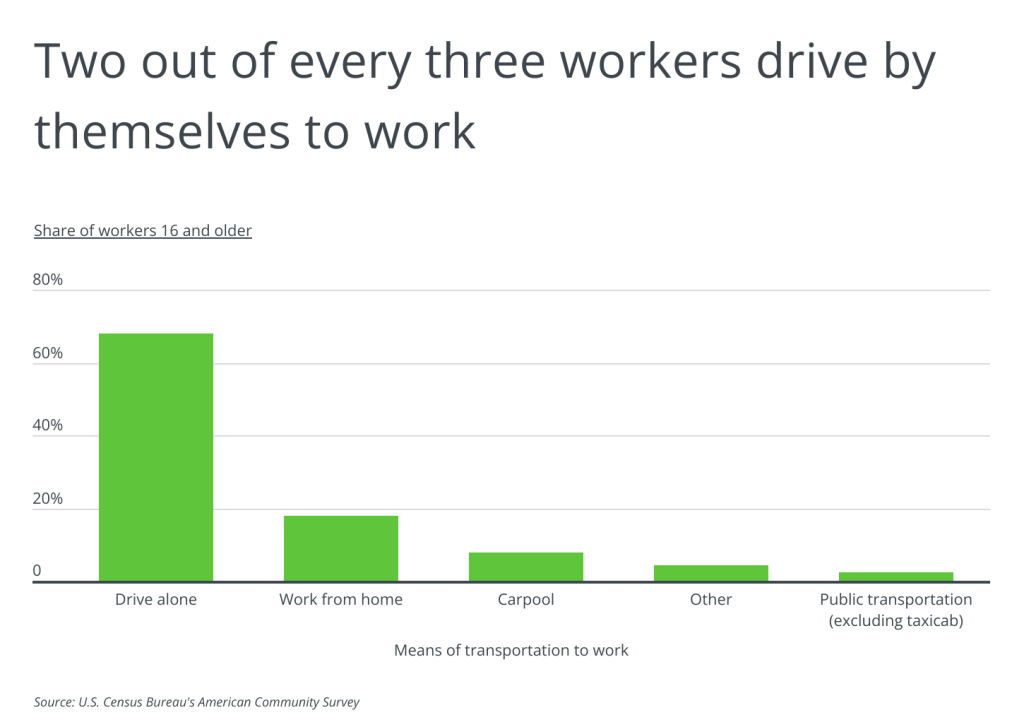
Commuting methods have changed over time. With two-thirds of workers driving alone to work, driving alone is still by far the most common mode of commuting. However, this figure is smaller than what it was pre-pandemic, when 76% of workers commuted by driving solo. Many of the workers who used to drive to work now work from home. In 2021, 18% of workers worked from home, triple the share from 2019. As more and more companies require workers to return to the office, the share of workers who drive to work is likely to increase.
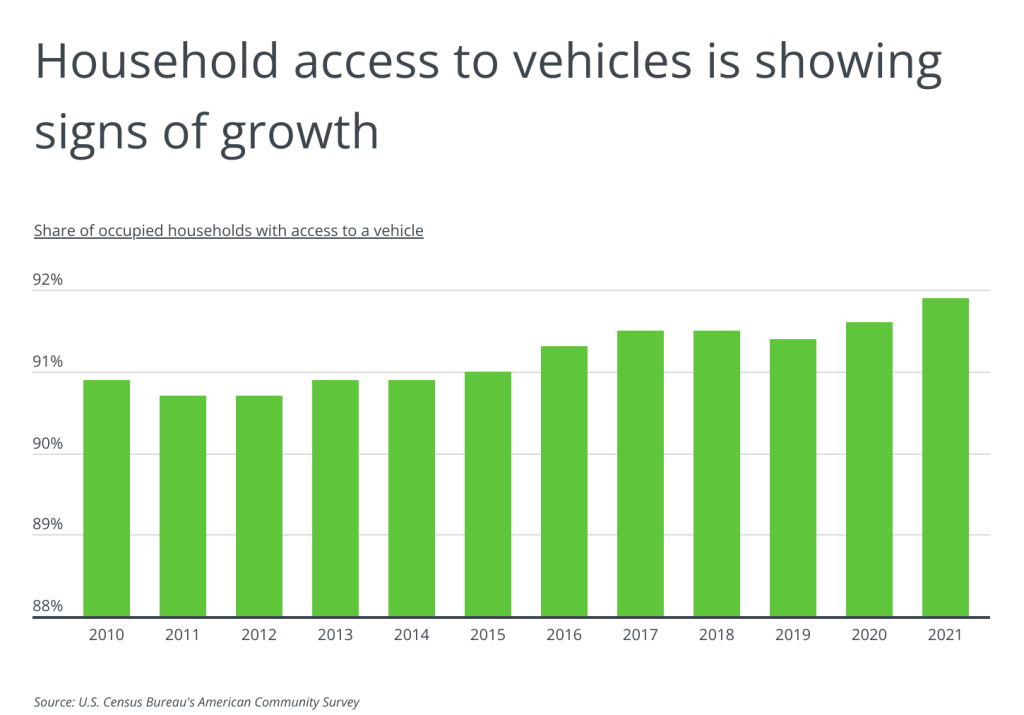
Household access to vehicles is on the rise and will likely contribute to an increase in car commuting in the coming years. In 2021, nearly 92% of households kept at least one automobile at home for use by household members, a share which has grown nearly steadily for the last decade. If increased vehicle access continues alongside workers returning to the office, traffic congestion will likely worsen.
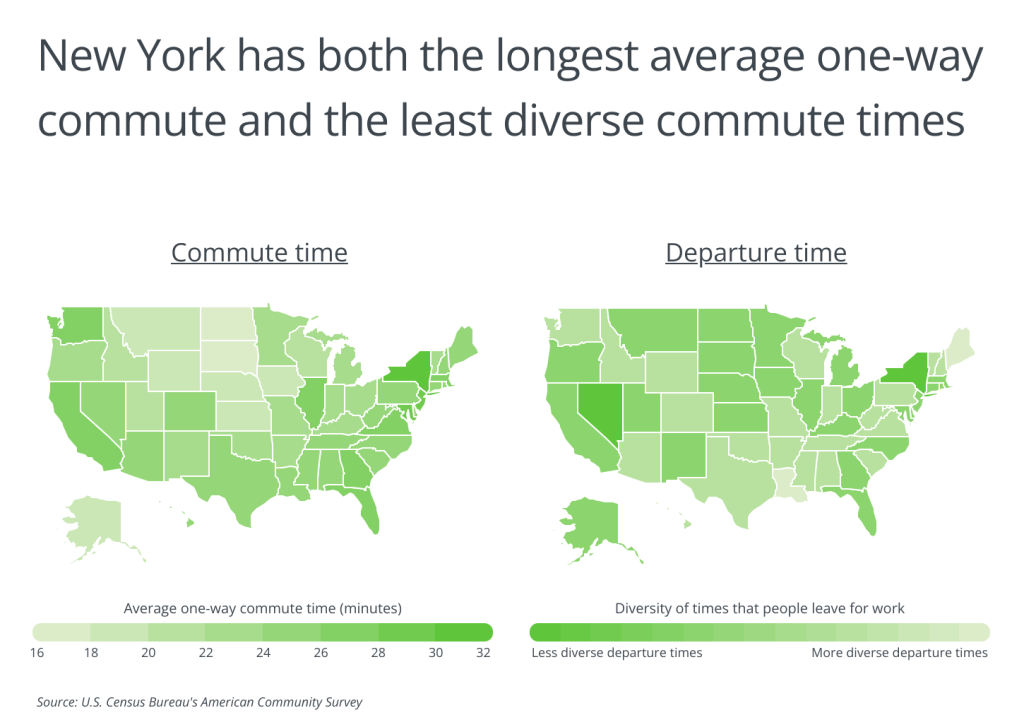
Commuting characteristics vary dramatically by location, so accounting for them when considering where to live can be important for quality of life. Commutes tend to be longer in the Northeast, the Southeast, and the West Coast, while workers in the Midwest have shorter commutes. At 32.6 minutes, the average one-way commute time is the longest in New York State. Commute times generally are inversely related to the diversity of times that people leave for work. Longer commutes are associated with less diversity in the times that people leave, and shorter average commute times are more common in states where workers leave at times that are spread across the day. Maine has the highest diversity of times that people leave for work, and also has one of the shortest average one-way commutes at 19.1 minutes.
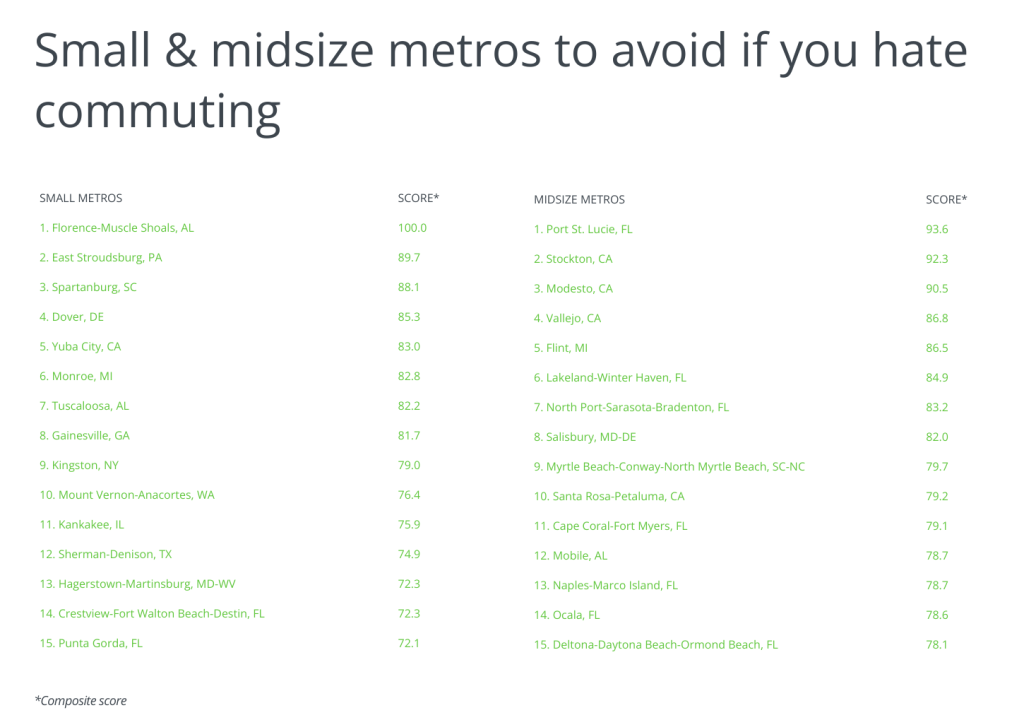
To determine the locations to avoid if you hate commuting, researchers at HireAHelper analyzed the latest data from the U.S. Census Bureau. The researchers ranked metros according to a composite score based on the following factors and weights:
- Average one-way commute time (40%)
- Share of workers who commute using private transportation (20%)
- Diversity of times that people leave for work (15%)
- Share of occupied households with access to a vehicle (15%)
- Population density (10%)
Based on their composite scores, here are the U.S. metropolitan areas to avoid if you hate commuting.
Large Metros To Avoid if You Hate Commuting

Photo Credit: yhelfman / Shutterstock
15. San Francisco-Oakland-Berkeley, CA
- Composite score: 68.6
- Average one-way commute time: 28.8 minutes
- Share of workers who commute using private transportation: 54.0%
- Diversity of times that people leave for work: Below average
- Share of occupied households with access to a vehicle: 88.7%
- Population density (people per square mile): 1,871.7

Photo Credit: Andrew Yoshiki / Shutterstock
14. San Antonio-New Braunfels, TX
- Composite score: 68.8
- Average one-way commute time: 25.8 minutes
- Share of workers who commute using private transportation: 79.9%
- Diversity of times that people leave for work: Average
- Share of occupied households with access to a vehicle: 94.8%
- Population density (people per square mile): 355.8

Photo Credit: Ingus Kruklitis / Shutterstock
13. New York-Newark-Jersey City, NY-NJ-PA
- Composite score: 68.9
- Average one-way commute time: 34.2 minutes
- Share of workers who commute using private transportation: 50.0%
- Diversity of times that people leave for work: Below average
- Share of occupied households with access to a vehicle: 70.2%
- Population density (people per square mile): 2,957.4

Photo Credit: Bonnie Fink / Shutterstock
12. Tampa-St. Petersburg-Clearwater, FL
- Composite score: 69.1
- Average one-way commute time: 26.7 minutes
- Share of workers who commute using private transportation: 75.1%
- Diversity of times that people leave for work: Average
- Share of occupied households with access to a vehicle: 94.0%
- Population density (people per square mile): 1,279.7

Photo Credit: f11photo / Shutterstock
11. Nashville-Davidson–Murfreesboro–Franklin, TN
- Composite score: 69.6
- Average one-way commute time: 26.2 minutes
- Share of workers who commute using private transportation: 76.6%
- Diversity of times that people leave for work: Above average
- Share of occupied households with access to a vehicle: 96.0%
- Population density (people per square mile): 353.9

Photo Credit: Rudy Balasko / Shutterstock
10. Indianapolis-Carmel-Anderson, IN
- Composite score: 70.6
- Average one-way commute time: 24.9 minutes
- Share of workers who commute using private transportation: 79.5%
- Diversity of times that people leave for work: Average
- Share of occupied households with access to a vehicle: 95.3%
- Population density (people per square mile): 494.5
Photo Credit: Sean Pavone / Shutterstock
9. Birmingham-Hoover, AL
- Composite score: 71.0
- Average one-way commute time: 26.2 minutes
- Share of workers who commute using private transportation: 84.0%
- Diversity of times that people leave for work: Above average
- Share of occupied households with access to a vehicle: 95.3%
- Population density (people per square mile): 248.2

Photo Credit: Chones / Shutterstock
8. Los Angeles-Long Beach-Anaheim, CA
- Composite score: 71.0
- Average one-way commute time: 28.4 minutes
- Share of workers who commute using private transportation: 71.6%
- Diversity of times that people leave for work: Below average
- Share of occupied households with access to a vehicle: 92.4%
- Population density (people per square mile): 2,678.2

Photo Credit: travelview / Shutterstock
7. Houston-The Woodlands-Sugar Land, TX
- Composite score: 72.6
- Average one-way commute time: 28.9 minutes
- Share of workers who commute using private transportation: 79.5%
- Diversity of times that people leave for work: Above average
- Share of occupied households with access to a vehicle: 94.2%
- Population density (people per square mile): 871.6
Photo Credit: Mihai Andritoiu / Shutterstock
6. Dallas-Fort Worth-Arlington, TX
- Composite score: 75.0
- Average one-way commute time: 27.3 minutes
- Share of workers who commute using private transportation: 76.2%
- Diversity of times that people leave for work: Average
- Share of occupied households with access to a vehicle: 95.5%
- Population density (people per square mile): 894.4
Photo Credit: ShengYing Lin / Shutterstock
5. Austin-Round Rock-Georgetown, TX
- Composite score: 75.6
- Average one-way commute time: 26.1 minutes
- Share of workers who commute using private transportation: 63.9%
- Diversity of times that people leave for work: Below average
- Share of occupied households with access to a vehicle: 95.9%
- Population density (people per square mile): 557.5
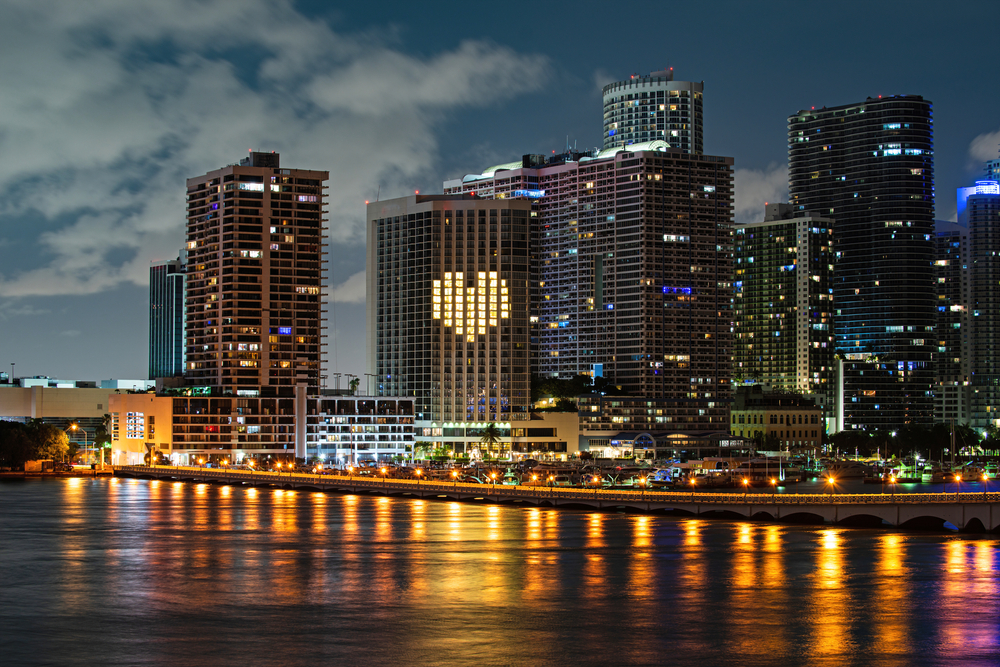
Photo Credit: Volodymyr TVERDOKHLIB / Shutterstock
4. Miami-Fort Lauderdale-Pompano Beach, FL
- Composite score: 76.1
- Average one-way commute time: 28.3 minutes
- Share of workers who commute using private transportation: 78.1%
- Diversity of times that people leave for work: Below average
- Share of occupied households with access to a vehicle: 92.2%
- Population density (people per square mile): 1,202.2

Photo Credit: ESB Professional / Shutterstock
3. Atlanta-Sandy Springs-Alpharetta, GA
- Composite score: 80.4
- Average one-way commute time: 29.6 minutes
- Share of workers who commute using private transportation: 72.2%
- Diversity of times that people leave for work: Average
- Share of occupied households with access to a vehicle: 95.2%
- Population density (people per square mile): 707.5
Photo Credit: Matt Gush / Shutterstock
2. Riverside-San Bernardino-Ontario, CA
- Composite score: 82.1
- Average one-way commute time: 32.2 minutes
- Share of workers who commute using private transportation: 83.1%
- Diversity of times that people leave for work: Above average
- Share of occupied households with access to a vehicle: 95.6%
- Population density (people per square mile): 170.6

Photo Credit: Songquan Deng / Shutterstock
1. Orlando-Kissimmee-Sanford, FL
- Composite score: 88.1
- Average one-way commute time: 28.3 minutes
- Share of workers who commute using private transportation: 77.2%
- Diversity of times that people leave for work: Below average
- Share of occupied households with access to a vehicle: 95.3%
- Population density (people per square mile): 771.0
Detailed Findings & Methodology
To determine the locations to avoid if you hate commuting, researchers at HireAHelper analyzed the latest data from the U.S. Census Bureau’s 2021 American Community Survey. The researchers ranked metros according to a composite score based on the following factors and weights:
- Average one-way commute time (40%)
- Share of workers who commute using private transportation (20%)
- Diversity of times that people leave for work (15%)
- Share of occupied households with access to a vehicle (15%)
- Population density (10%)
The diversity of times that people leave for work is calculated using Simpson’s Diversity Index, where a high level of diversity indicates that people leave for work at times spread out across the day (less congestion) and a low level of diversity indicates that people leave for work largely at the same time (more congestion).
To improve relevance, only metropolitan areas with at least 100,000 people were included in the analysis. Additionally, metro areas were grouped into the following cohorts based on population size:
- Small metros: 100,000–349,999
- Midsize metros: 350,000–999,999
- Large metros: more than 1,000,000