International travel has skyrocketed in 2023, driven in large part by pent-up demand from the COVID-19 pandemic. And while the winter holiday season is not as busy as the summer months, December is still a very popular time for U.S. travelers to head abroad.
Apart from higher ticket prices and longer flight times, one of the biggest inconveniences of traveling internationally is the ever-dreaded wait at immigration checkpoints. “Being stuck in a traffic jam at customs after an already lengthy day of travel can really sour an otherwise great vacation,” explained Alex Miller, Founder and CEO of Upgraded Points, a travel and finance website.
Fortunately, many factors within the traveler’s control—including choice of airport—can increase the likelihood of an efficient travel day this holiday season.
Factors Affecting Immigration and Customs Wait Times
Despite common perceptions, immigration and customs wait times at U.S. international airports are typically reasonable, even during the winter holiday period (the week before Christmas through the New Year holiday). The average wait time during the winter holidays in 2022 hovered just below 23 minutes, aligning closely with the rest of the year. Nearly half of travelers enjoyed wait times of 15 minutes or less, while a mere 6.5% endured waits of 60 minutes or more.
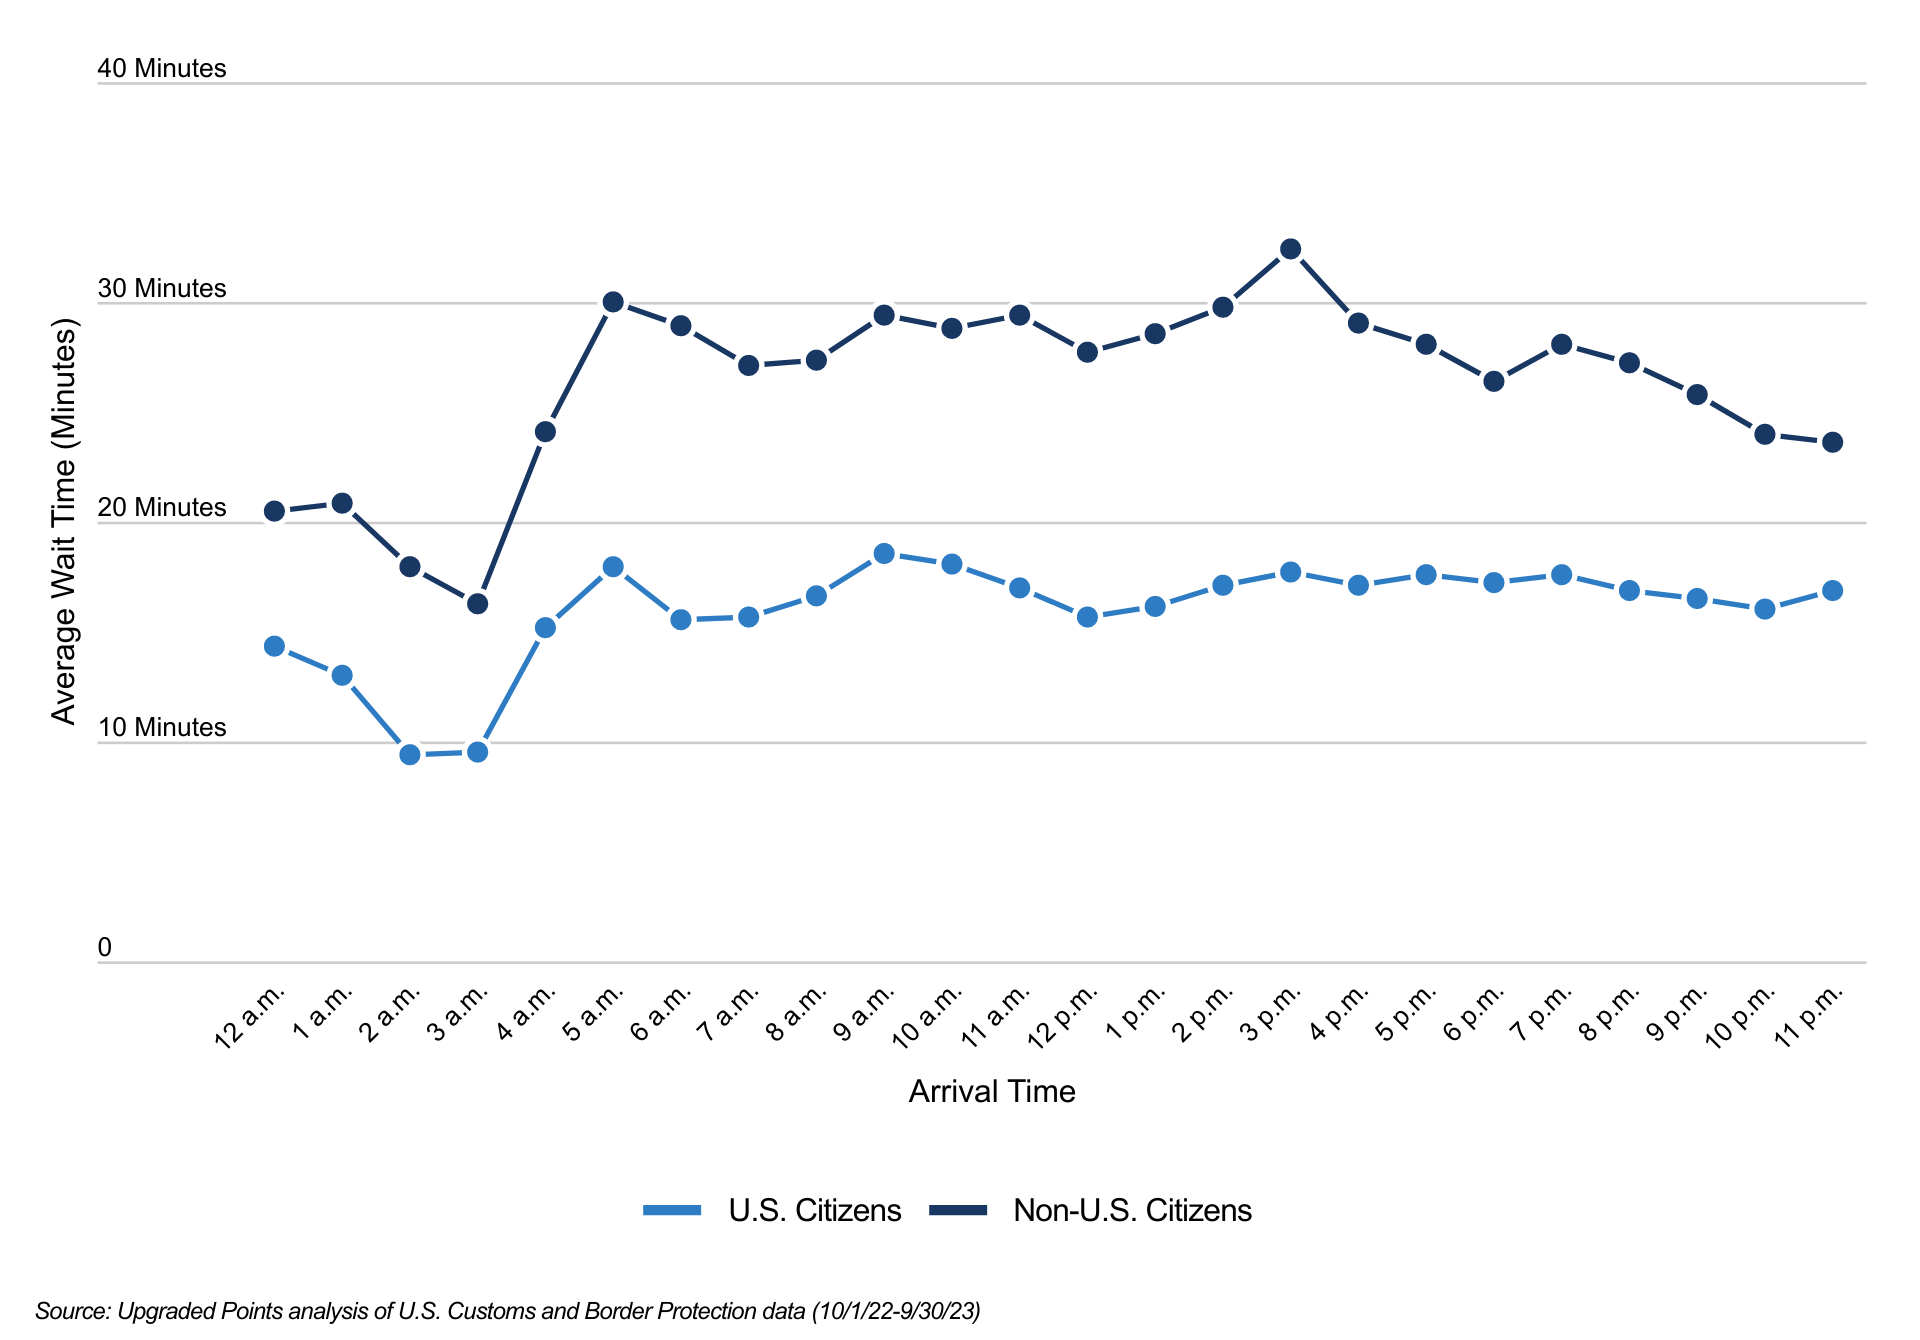
However, factors such as arrival time and citizenship status significantly impact how long it takes travelers to clear these checkpoints. Arrival between 5:00 AM and 3:00 PM results in approximately 20% longer wait times compared to other hours of the day. Likewise, non-U.S. citizens can expect to wait roughly 66% longer than U.S. citizens, with non-citizens averaging over 28 minutes and U.S. citizens averaging 17 minutes for clearing immigration and customs.
Immigration and Customs Wait Times by Airport
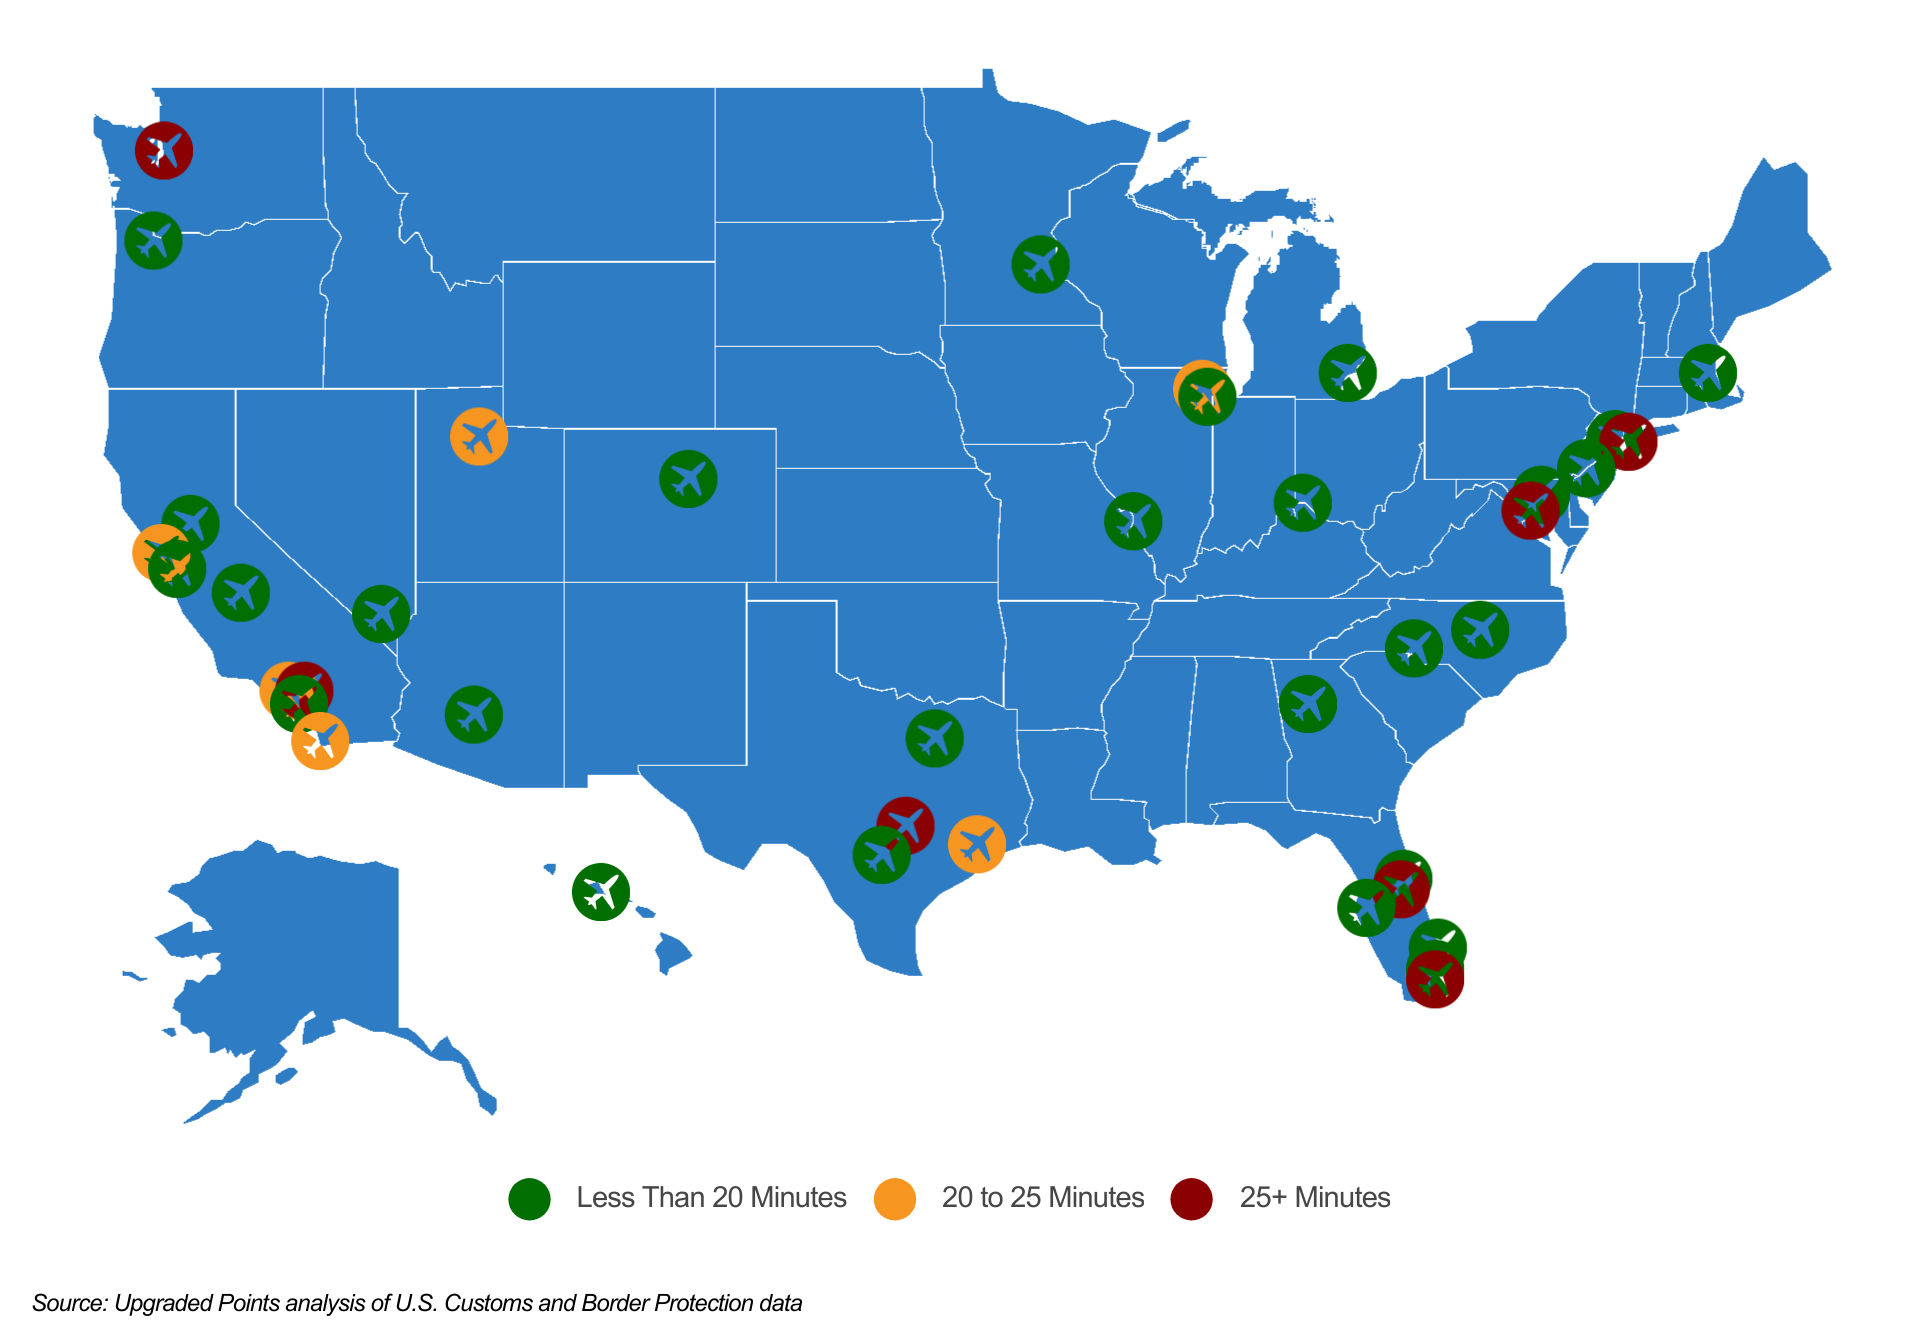
When it comes to wait times, airport choice is the single most important factor. And perhaps surprisingly, there isn’t a strong correlation between immigration wait times and airport size. For example, out of 41 major international airports in the U.S. tracked by the U.S. Customs and Border Protection:
- Seattle–Tacoma International Airport (SEA) is ranked 14th by total international travel volume but reported the worst average wait time during the 2022 winter holiday travel season at 31.6 minutes.
- Miami International Airport (MIA) ranks second for both international travel volume and average wait time.
- Austin–Bergstrom International Airport (AUS) is ranked 25th by total international travel volume, but reported the third worst winter holiday wait time at 29.2 minutes.
At the opposite end of the spectrum, John Wayne Airport (SNA) reported the shortest average winter holiday wait time last year at 4.6 minutes. However, it’s worth noting that SNA is among the nation’s smaller international airports in terms of passenger traffic. In stark contrast, Phoenix Sky Harbor International Airport (PHX) distinguished itself by efficiently processing a substantial volume of international passengers. Despite PHX being nearly 10 times busier than SNA, the average wait time during the holiday season was only marginally longer, standing at less than 6 minutes.
Below is a breakdown of the best U.S. airports for international travel during the winter holiday season. The analysis was conducted by researchers at Upgraded Points using data from U.S. Customs and Border Protection. The data shown is for travelers passing through immigration and customs during the 2022 winter holiday travel season (the week before Christmas through the New Year holiday).
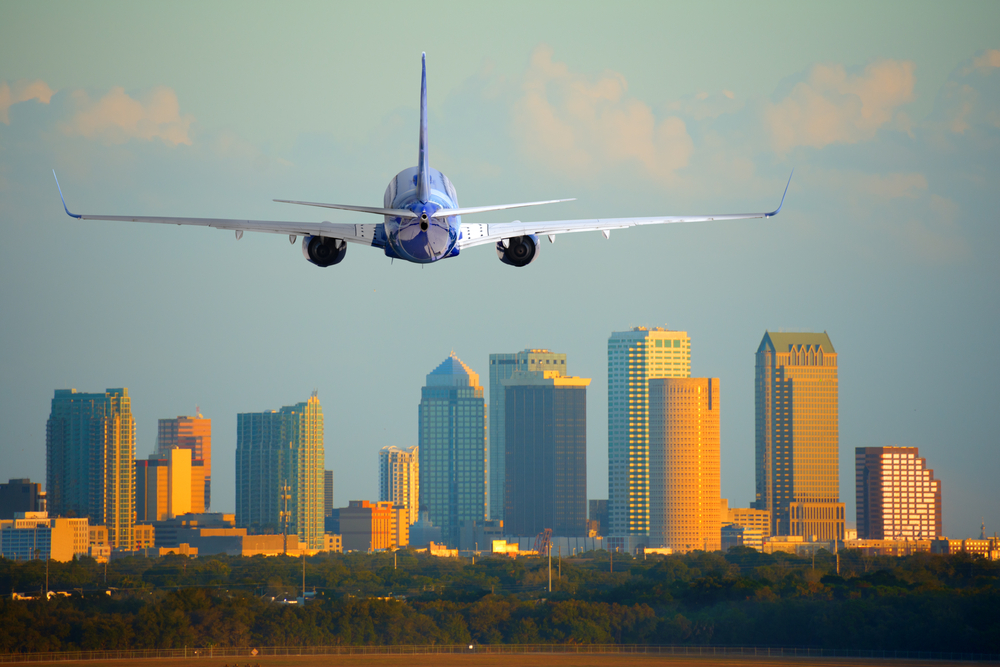
Photo Credit: Michael O’Keene / Shutterstock
15. Tampa International Airport
- Primary City: Tampa, FL
- Average wait time for all travelers (minutes): 19.5
- Average max wait time for all travelers (minutes): 46.7
- Average wait time for U.S. citizens (minutes): 10.3
- Average wait time for non-U.S. citizens (minutes): 25.5
- Share of all travelers that wait <15 minutes: 50.0%
- Share of all travelers that wait >60 minutes: 3.9%
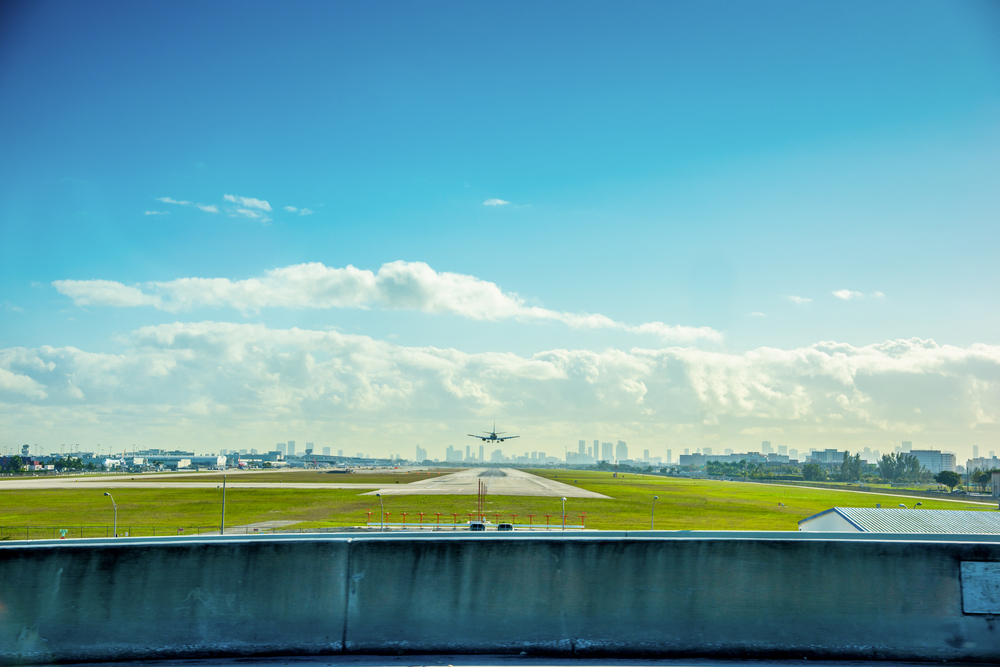
Photo Credit: Gabriele Maltinti / Shutterstock
14. Fort Lauderdale–Hollywood International Airport
- Primary City: Fort Lauderdale, FL
- Average wait time for all travelers (minutes): 19.8
- Average max wait time for all travelers (minutes): 56.2
- Average wait time for U.S. citizens (minutes): 13.8
- Average wait time for non-U.S. citizens (minutes): 24.5
- Share of all travelers that wait <15 minutes: 49.5%
- Share of all travelers that wait >60 minutes: 5.8%
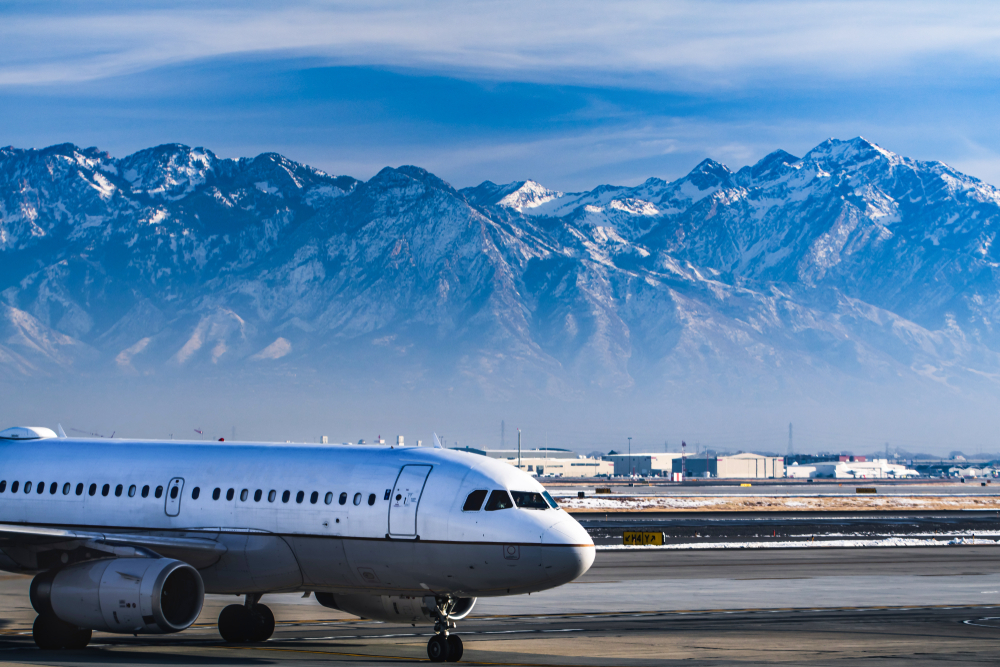
Photo Credit: Brandon Jenner / Shutterstock
13. Salt Lake City International Airport
- Primary City: Salt Lake City, UT
- Average wait time for all travelers (minutes): 20.9
- Average max wait time for all travelers (minutes): 42.0
- Average wait time for U.S. citizens (minutes): 19.8
- Average wait time for non-U.S. citizens (minutes): 23.5
- Share of all travelers that wait <15 minutes: 35.4%
- Share of all travelers that wait >60 minutes: 2.0%
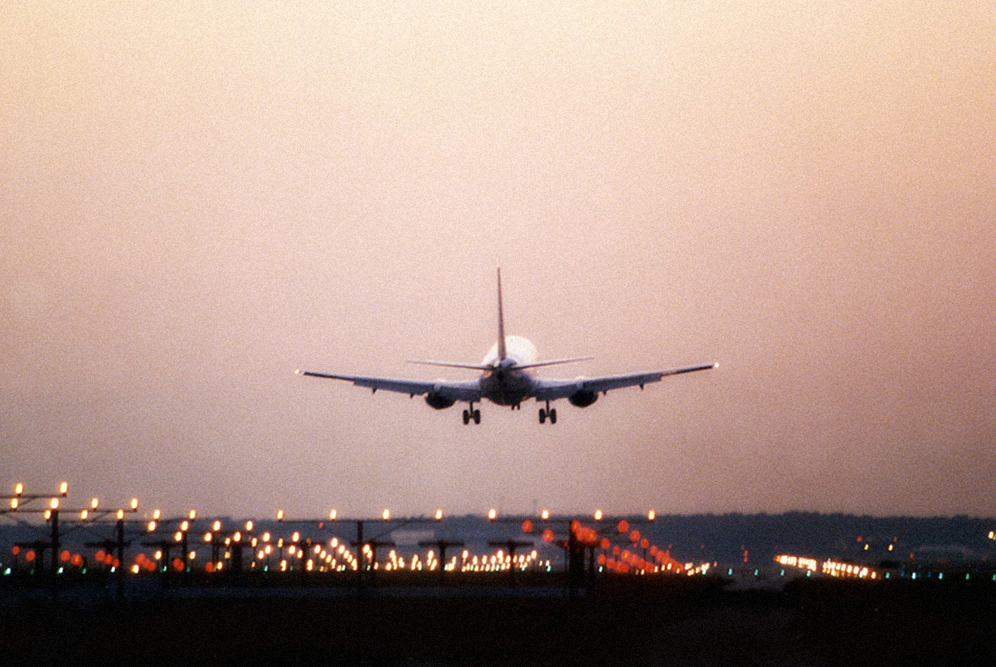
Photo Credit: Gary Paul Lewis / Shutterstock
12. George Bush Intercontinental Airport
- Primary City: Houston, TX
- Average wait time for all travelers (minutes): 21.4
- Average max wait time for all travelers (minutes): 57.8
- Average wait time for U.S. citizens (minutes): 17.4
- Average wait time for non-U.S. citizens (minutes): 25.7
- Share of all travelers that wait <15 minutes: 45.0%
- Share of all travelers that wait >60 minutes: 3.9%
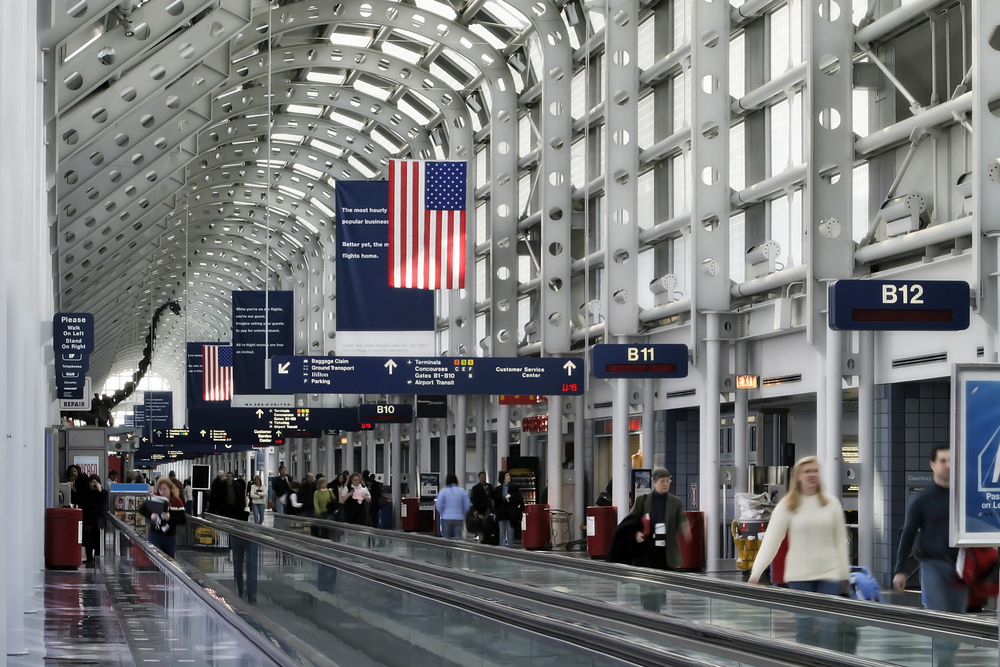
Photo Credit: Kevin Tavares / Shutterstock
11. Chicago O’Hare International Airport
- Primary City: Chicago, IL
- Average wait time for all travelers (minutes): 22.3
- Average max wait time for all travelers (minutes): 52.7
- Average wait time for U.S. citizens (minutes): 21.0
- Average wait time for non-U.S. citizens (minutes): 24.2
- Share of all travelers that wait <15 minutes: 44.2%
- Share of all travelers that wait >60 minutes: 5.8%
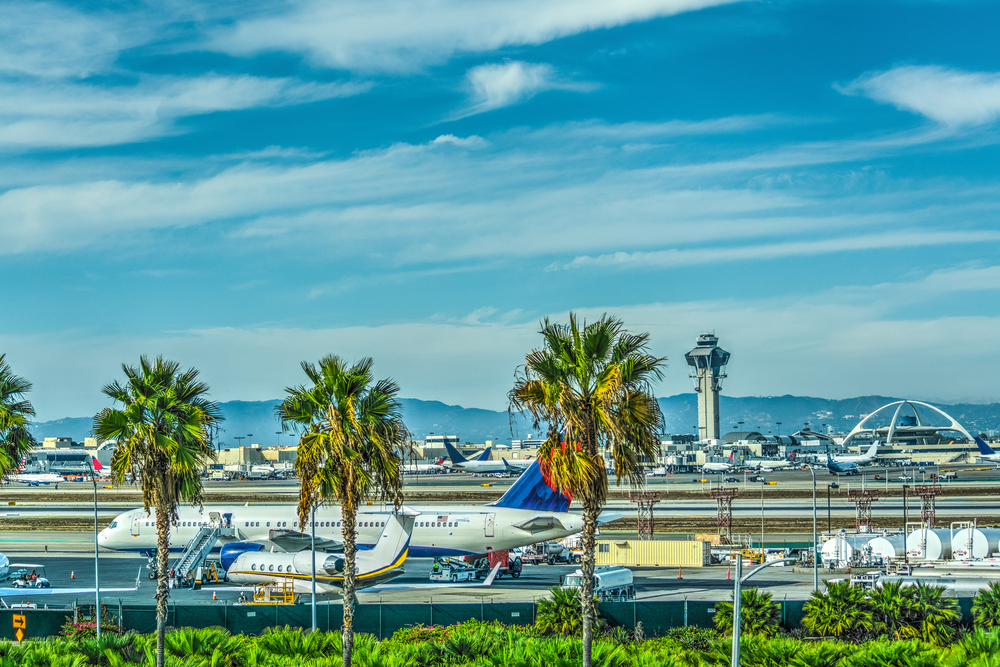
Photo Credit: Gabriele Maltinti / Shutterstock
10. Los Angeles International Airport
- Primary City: Los Angeles, CA
- Average wait time for all travelers (minutes): 22.8
- Average max wait time for all travelers (minutes): 61.2
- Average wait time for U.S. citizens (minutes): 16.2
- Average wait time for non-U.S. citizens (minutes): 28.7
- Share of all travelers that wait <15 minutes: 40.1%
- Share of all travelers that wait >60 minutes: 5.3%
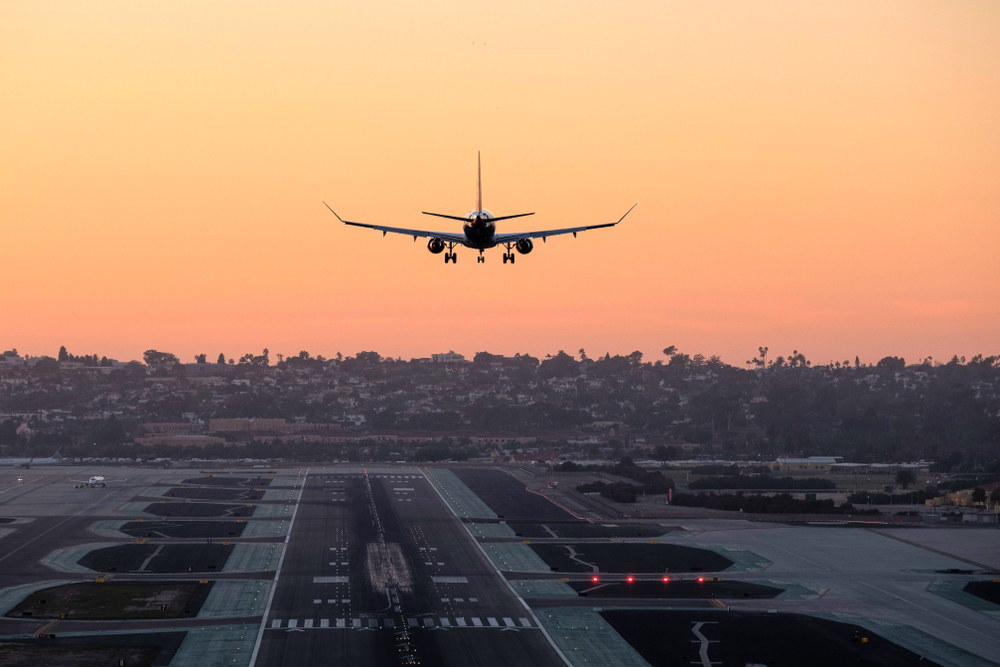
Photo Credit: Dbsocal / Shutterstock
9. San Diego International Airport
- Primary City: San Diego, CA
- Average wait time for all travelers (minutes): 23.3
- Average max wait time for all travelers (minutes): 50.9
- Average wait time for U.S. citizens (minutes): 19.0
- Average wait time for non-U.S. citizens (minutes): 28.5
- Share of all travelers that wait <15 minutes: 35.1%
- Share of all travelers that wait >60 minutes: 3.2%
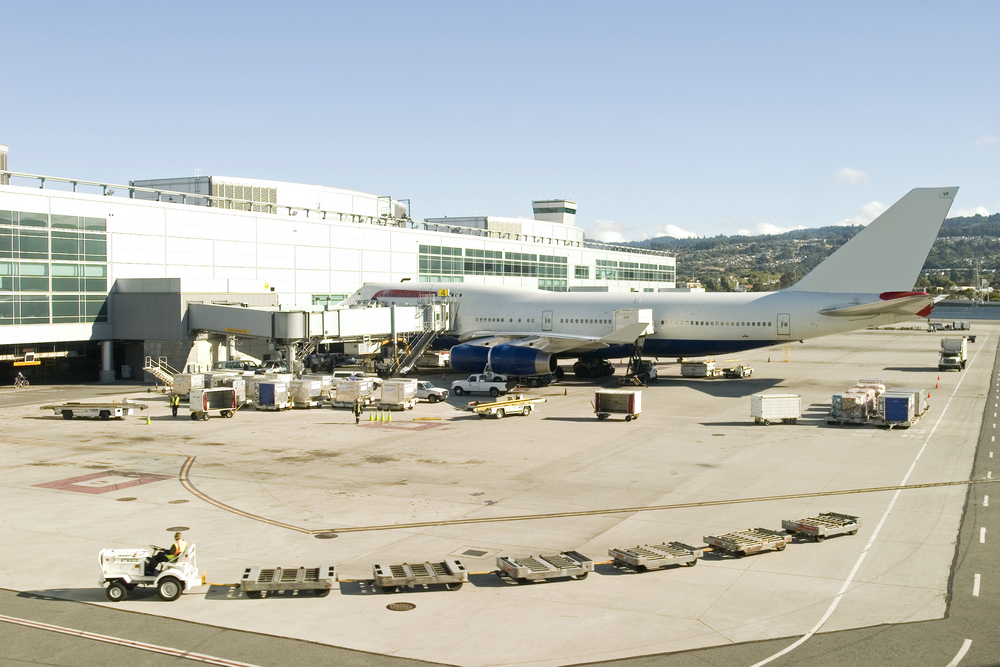
Photo Credit: Rafael Ramirez Lee / Shutterstock
8. San Francisco International Airport
- Primary City: San Francisco, CA
- Average wait time for all travelers (minutes): 23.8
- Average max wait time for all travelers (minutes): 56.2
- Average wait time for U.S. citizens (minutes): 18.5
- Average wait time for non-U.S. citizens (minutes): 29.7
- Share of all travelers that wait <15 minutes: 40.4%
- Share of all travelers that wait >60 minutes: 6.0%
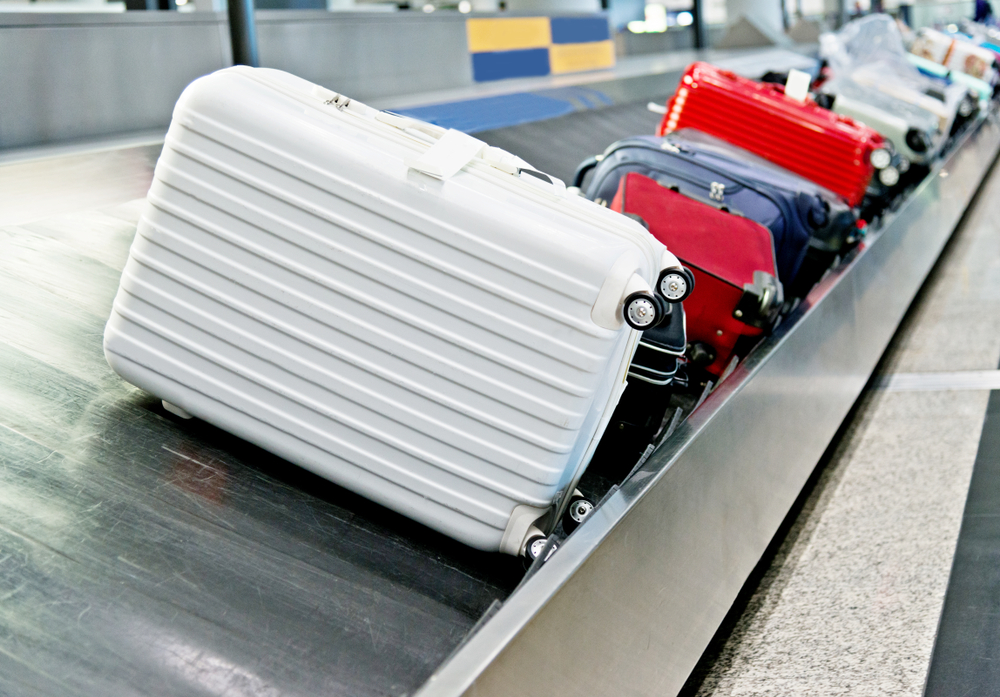
Photo Credit: hxdbzxy / Shutterstock
7. Ontario International Airport
- Primary City: Ontario, CA
- Average wait time for all travelers (minutes): 25.1
- Average max wait time for all travelers (minutes): 48.5
- Average wait time for U.S. citizens (minutes): 22.0
- Average wait time for non-U.S. citizens (minutes): 27.5
- Share of all travelers that wait <15 minutes: 31.6%
- Share of all travelers that wait >60 minutes: 4.3%
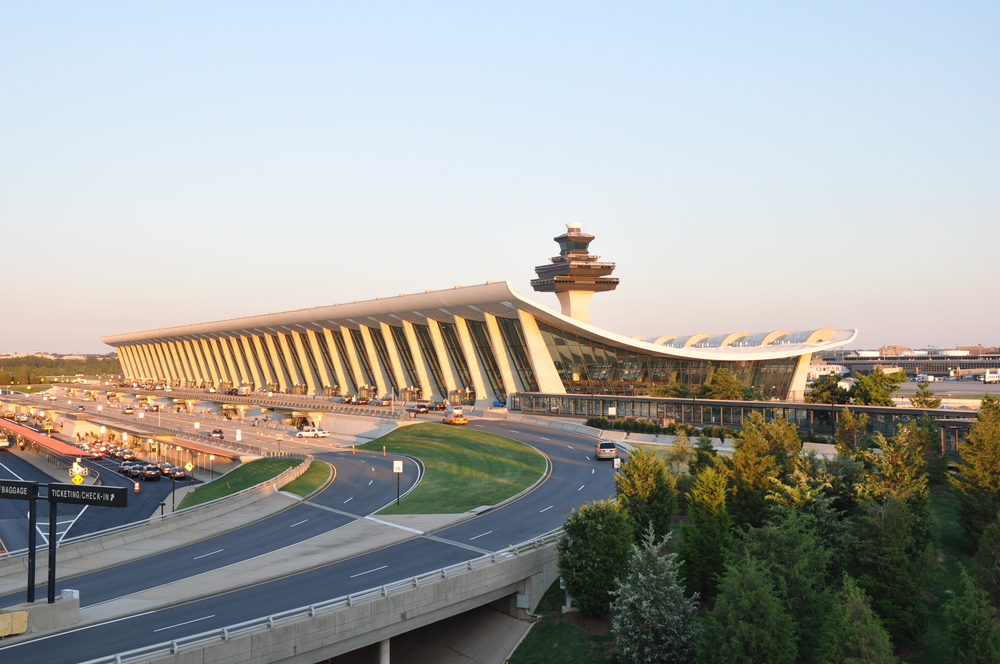
Photo Credit: Joe Ravi / Shutterstock
6. Washington Dulles International Airport
- Primary City: Washington, D.C.
- Average wait time for all travelers (minutes): 26.1
- Average max wait time for all travelers (minutes): 71.0
- Average wait time for U.S. citizens (minutes): 21.2
- Average wait time for non-U.S. citizens (minutes): 33.7
- Share of all travelers that wait <15 minutes: 46.7%
- Share of all travelers that wait >60 minutes: 13.5%
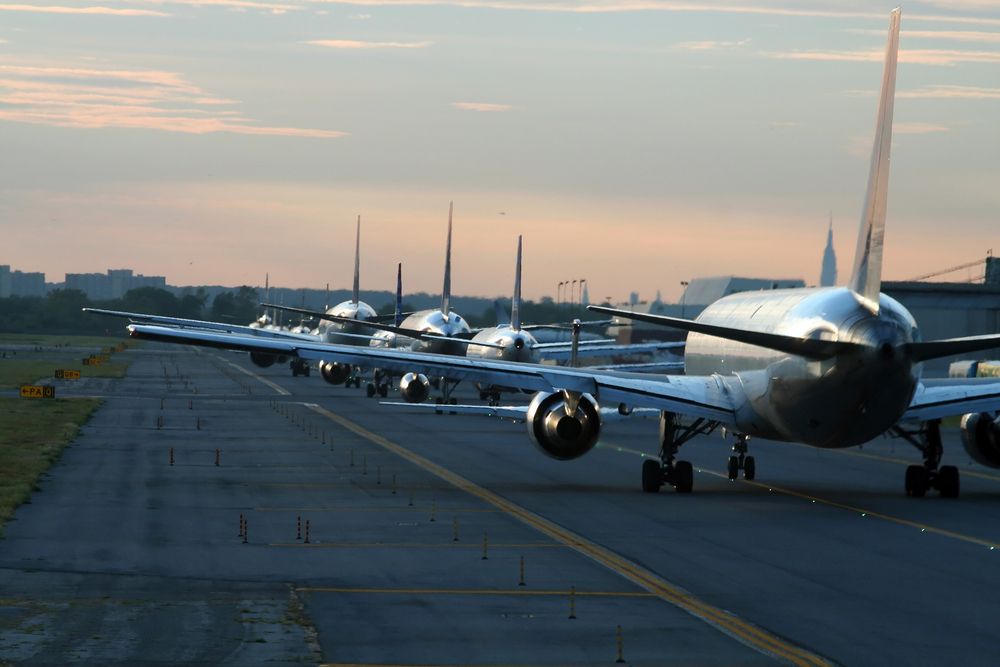
Photo Credit: Xavier Marchant / Shutterstock
5. John F. Kennedy International Airport
- Primary City: New York, NY
- Average wait time for all travelers (minutes): 27.4
- Average max wait time for all travelers (minutes): 62.8
- Average wait time for U.S. citizens (minutes): 17.8
- Average wait time for non-U.S. citizens (minutes): 33.6
- Share of all travelers that wait <15 minutes: 38.5%
- Share of all travelers that wait >60 minutes: 10.4%
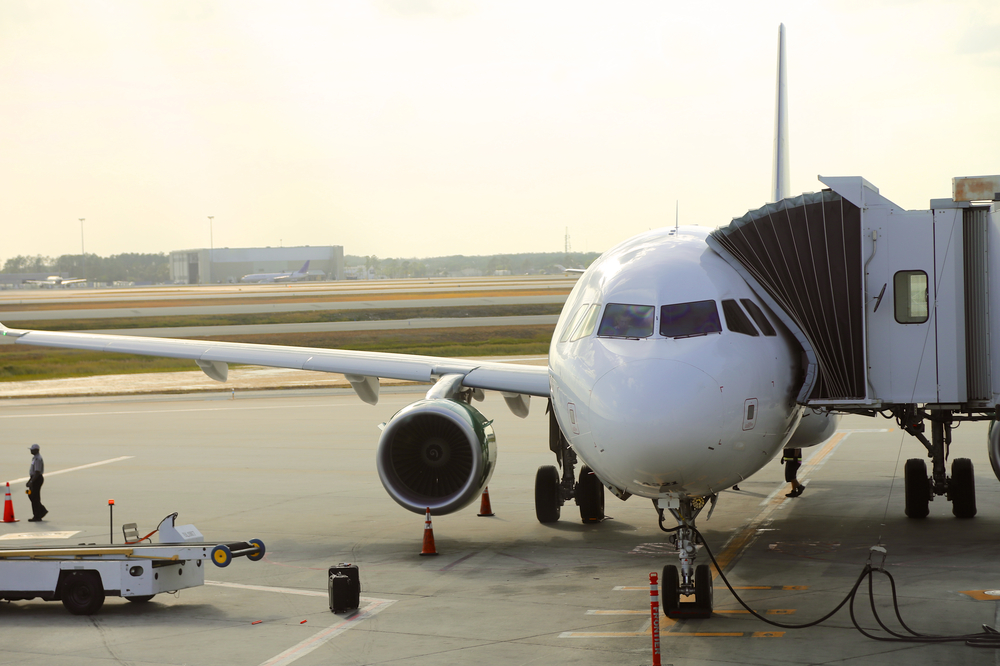
Photo Credit: Steve Boice / Shutterstock
4. Orlando International Airport
- Primary City: Orlando, FL
- Average wait time for all travelers (minutes): 27.8
- Average max wait time for all travelers (minutes): 55.0
- Average wait time for U.S. citizens (minutes): 19.6
- Average wait time for non-U.S. citizens (minutes): 30.7
- Share of all travelers that wait <15 minutes: 37.9%
- Share of all travelers that wait >60 minutes: 10.7%
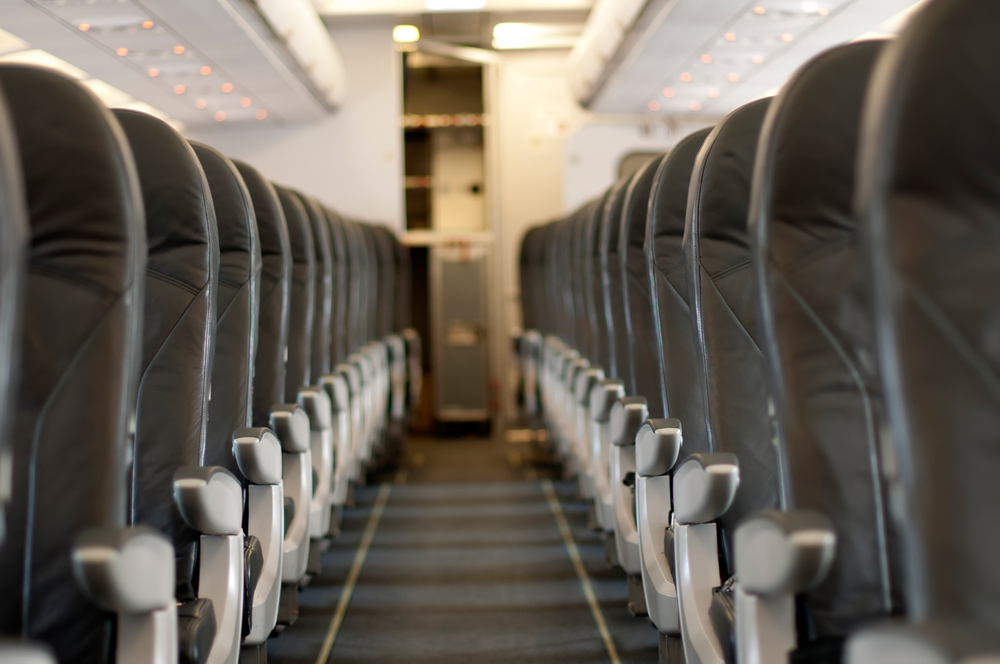
Photo Credit: Deyan Georgiev / Shutterstock
3. Austin–Bergstrom International Airport
- Primary City: Austin, TX
- Average wait time for all travelers (minutes): 29.2
- Average max wait time for all travelers (minutes): 59.2
- Average wait time for U.S. citizens (minutes): 26.9
- Average wait time for non-U.S. citizens (minutes): 33.5
- Share of all travelers that wait <15 minutes: 34.3%
- Share of all travelers that wait >60 minutes: 11.6%
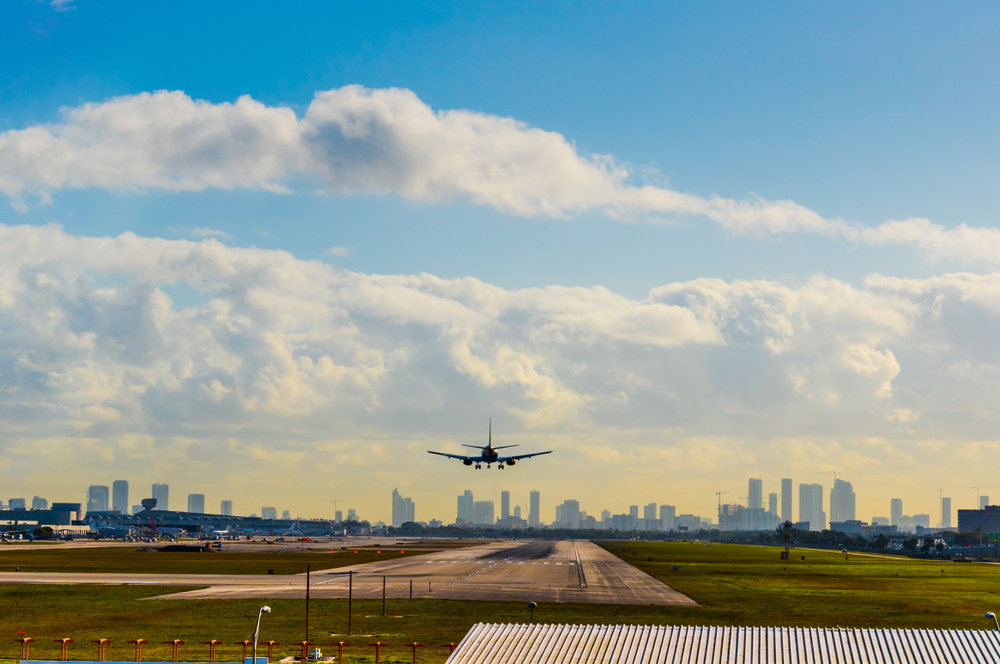
Photo Credit: Gabriele Maltinti / Shutterstock
2. Miami International Airport
- Primary City: Miami, FL
- Average wait time for all travelers (minutes): 30.6
- Average max wait time for all travelers (minutes): 79.8
- Average wait time for U.S. citizens (minutes): 18.3
- Average wait time for non-U.S. citizens (minutes): 38.2
- Share of all travelers that wait <15 minutes: 33.5%
- Share of all travelers that wait >60 minutes: 13.2%
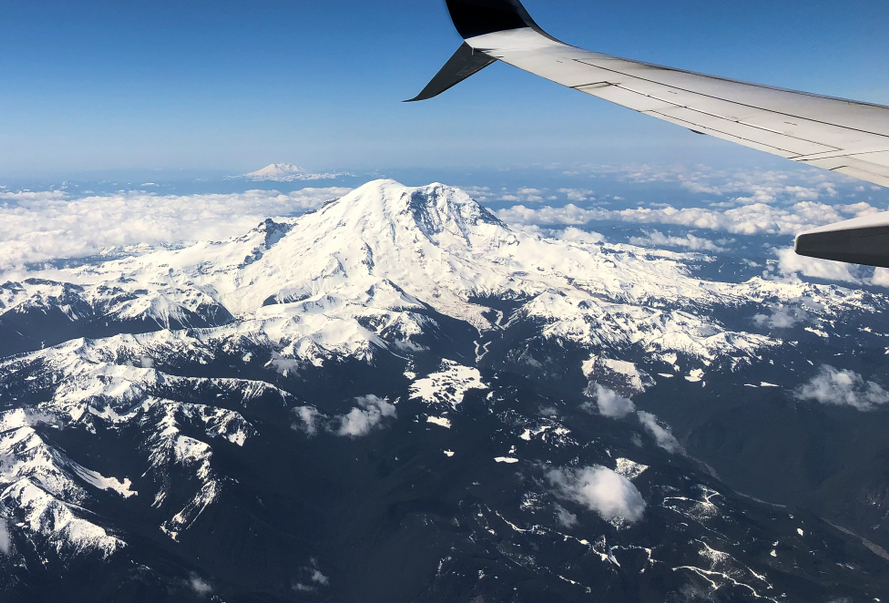
Photo Credit: FocusFantastic / Shutterstock
1. Seattle–Tacoma International Airport
- Primary City: Seattle, WA
- Average wait time for all travelers (minutes): 31.6
- Average max wait time for all travelers (minutes): 74.4
- Average wait time for U.S. citizens (minutes): 27.3
- Average wait time for non-U.S. citizens (minutes): 37.1
- Share of all travelers that wait <15 minutes: 31.3%
- Share of all travelers that wait >60 minutes: 14.6%
Methodology

The data used in this study is from the U.S. Customs and Border Protection’s CBP Airport Wait Times dataset.
To determine the best and worst airports for international travel this winter holiday season, researchers at Upgraded Points calculated average wait times for travelers passing through customs during the 2022 winter holiday travel season (the week before Christmas through the New Year holiday). All major U.S. international airports tracked by the CBP were included. Researchers also calculated the average max wait time for all travelers, which is a total traveler-weighted average of the hourly maximum wait times reported for each airport over the study period.
Average holiday wait times for U.S. citizens and non-U.S. citizens, the percentage of all travelers that passed through customs in under 15 minutes, and the percentage of all travelers that passed through customs in greater than 60 minutes during the same time period were also included.
For complete results, see The Worst Airports for International Travel This Holiday Season on Upgraded Points.