
With the launch of Apple’s App Store and the subsequent rise of the Android marketplace, the mobile application landscape has undergone exponential growth and evolution. What began with just a few hundred applications tailored for the inaugural iPhone, the App Store has since grown to host nearly 2 million apps. The Android app ecosystem, while different in certain respects from its iOS counterpart, also hosts a comparable array of offerings for consumers to choose from.
The meteoric rise of mobile apps has not only transformed the digital landscape, but has also become a lucrative industry for developers worldwide. Last year, Apple reported that App Store developers now generate more than $1 trillion in total billings and sales annually, growing 29% year over year. Developers, ranging from independent creators to established companies, have capitalized on this growing demand, contributing to the diversity and innovation evident in the wide range of mobile applications available today.
From the surge in demand for productivity tools, remote collaboration platforms, and home wellness apps catalyzed by the shift to remote work, to the burgeoning interest in A.I. chat and messaging bots, there exists a never-ending stream of ideas that might inspire the next mobile app. However, what app developers actually earn from these endeavors ranges widely. To shed light on these trends, Flippa—the largest online marketplace for buying and selling businesses—analyzed its internal data of more than 3,000 mobile apps listed over the past two years. Below is a breakdown of the findings.
Revenue & Profit Growth
Between 2022 and 2023, mobile apps experienced substantial financial growth
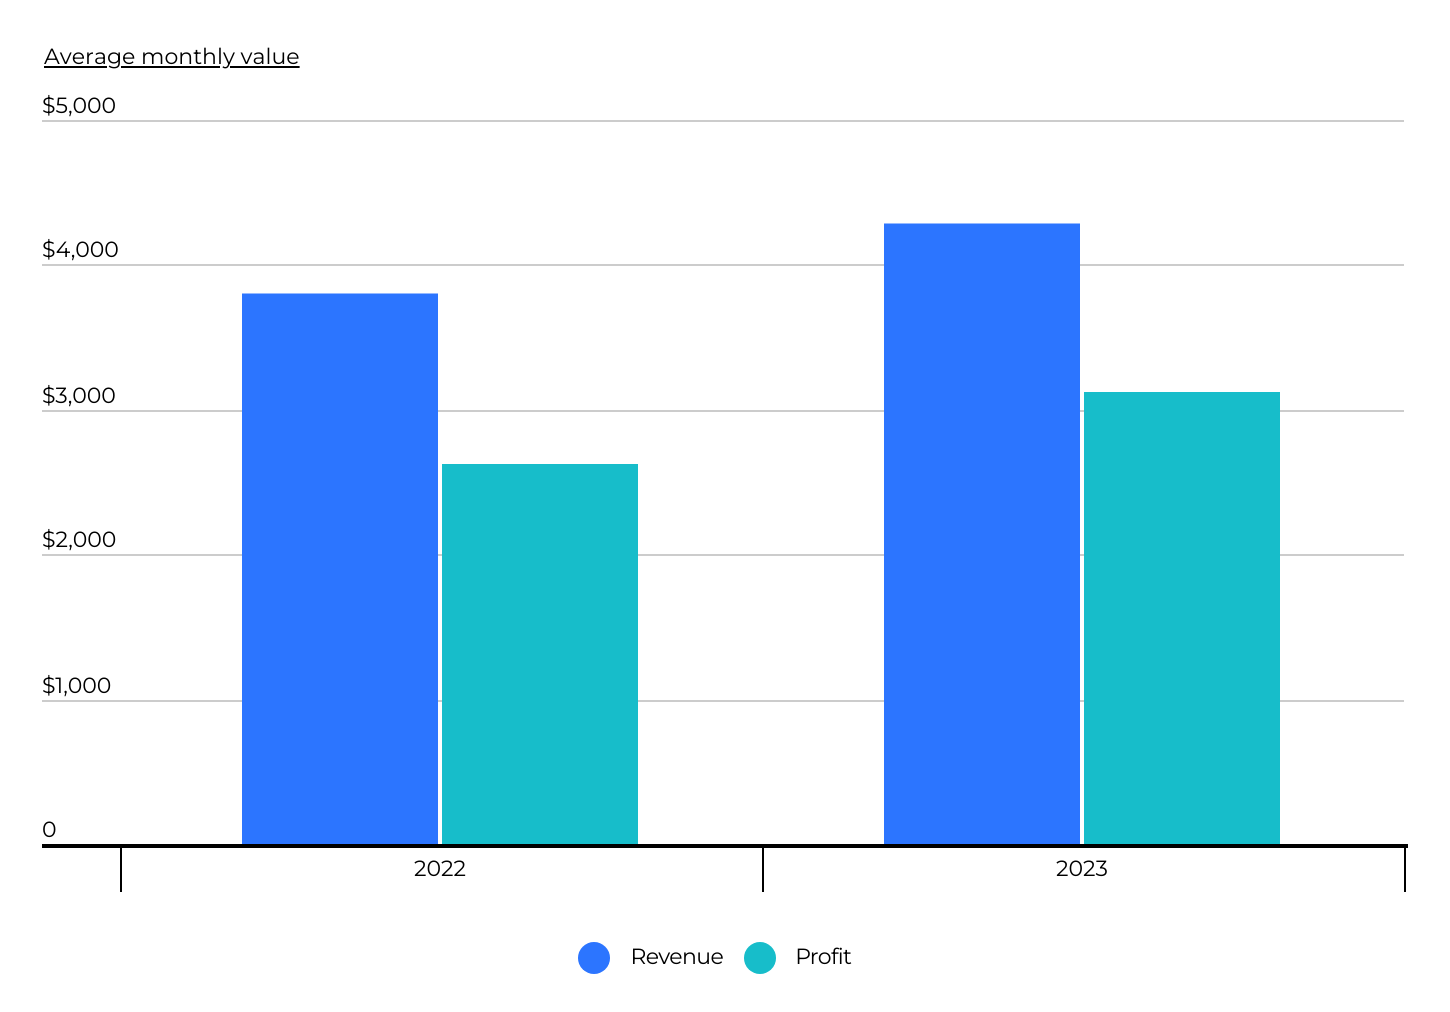
Source: Flippa marketplace transactions (2022–2023) | Image Credit: Flippa
Following the trend of increased online activity since the start of the COVID-19 pandemic, mobile app businesses saw significant financial growth last year. In 2023, the average monthly revenue for mobile apps was $4,286, up from $3,801 in 2022. Similarly, the average monthly profit increased from about $2,624 in 2022 to $3,121 in 2023. These rises in average revenue and profit represent 13% and 19% year-over-year growth, respectively.
Monetization Method
Compared to other monetization methods, subscription-based mobile apps tend to be the most lucrative
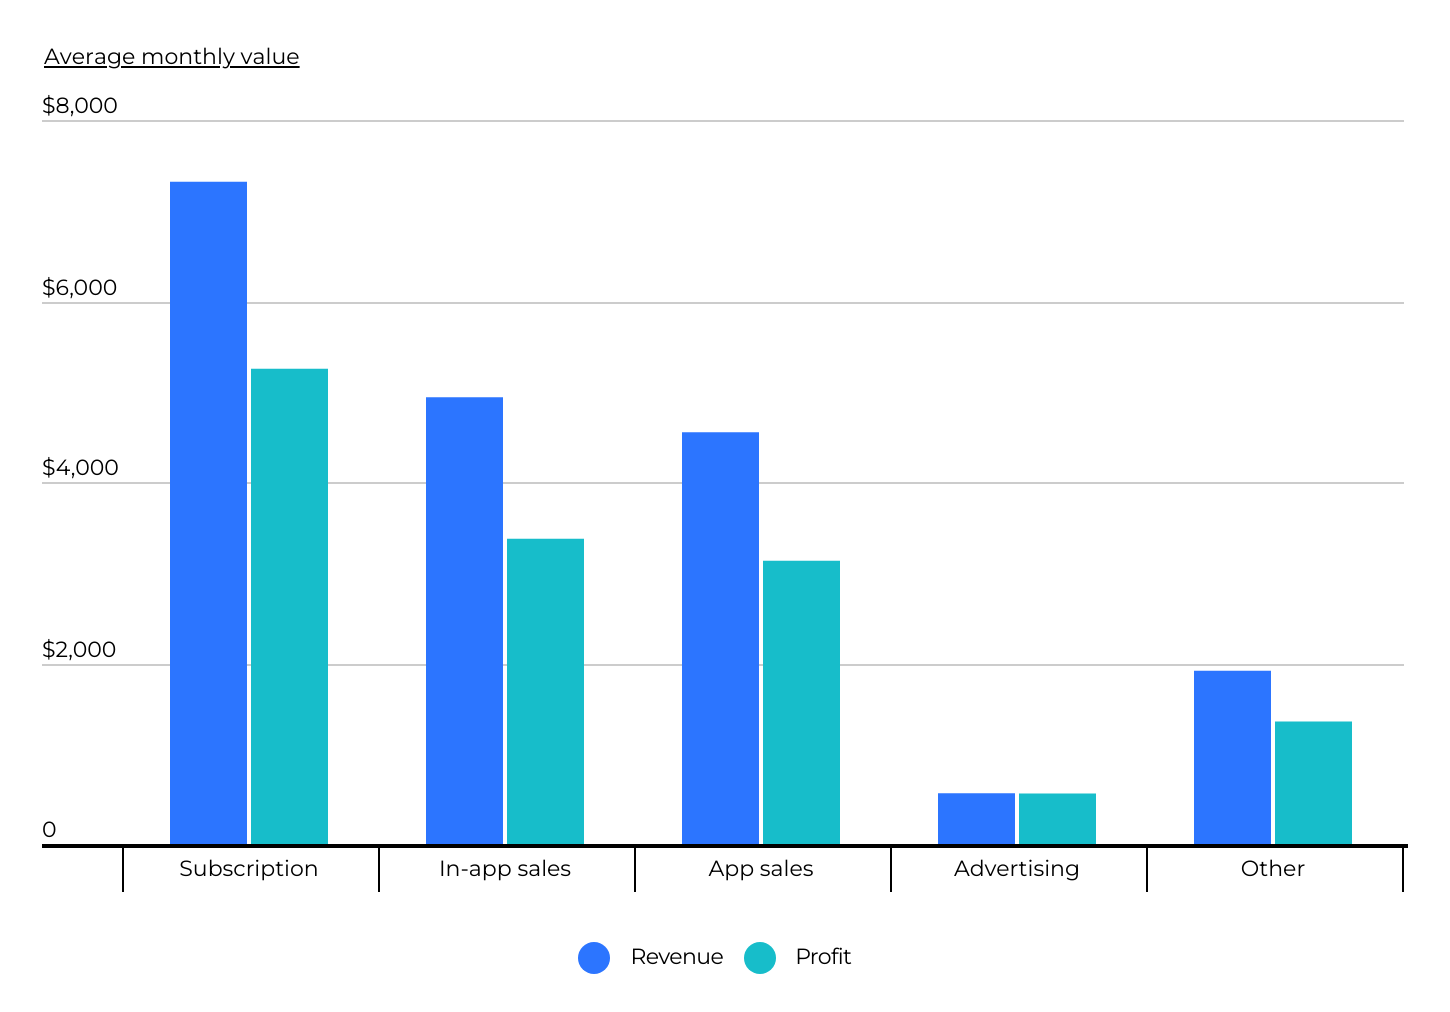
Source: Flippa marketplace transactions (2022–2023) | Image Credit: Flippa
Mobile app developers have a range of options available when it comes to monetizing their products. Among the most prevalent methods are subscriptions, app sales, in-app purchases, and advertising.
Subscription-based models entail users paying either a recurring monthly or annual fee for access to the app’s features or content. Some apps offer tiered subscriptions, granting varying levels of access. Financially, subscription-based apps tend to outperform other monetization strategies. In the past two years, these apps have boasted an average monthly revenue of $7,318, surpassing the earnings of both app sales and in-app purchases by over 50%.
App sales involve users making a one-time payment to download the application. For instance, an advanced productivity or project management app might be priced at $9.99 for a one-time download. Conversely, far more apps are free to download but offer additional features or ad removal through in-app purchases. Both app sales and in-app purchases generate comparable financial performance, falling between subscription-based and ad-based revenue models.
Advertising, typically in the form of visual display ads, represents another common avenue for app monetization. However, financially, ad-based apps tend to fare the poorest. Over the past two years, these apps have averaged just $562 in monthly revenue, demonstrating their comparatively limited earning potential in the mobile app market.
Operating System
iOS apps consistently generate more revenue than Android apps
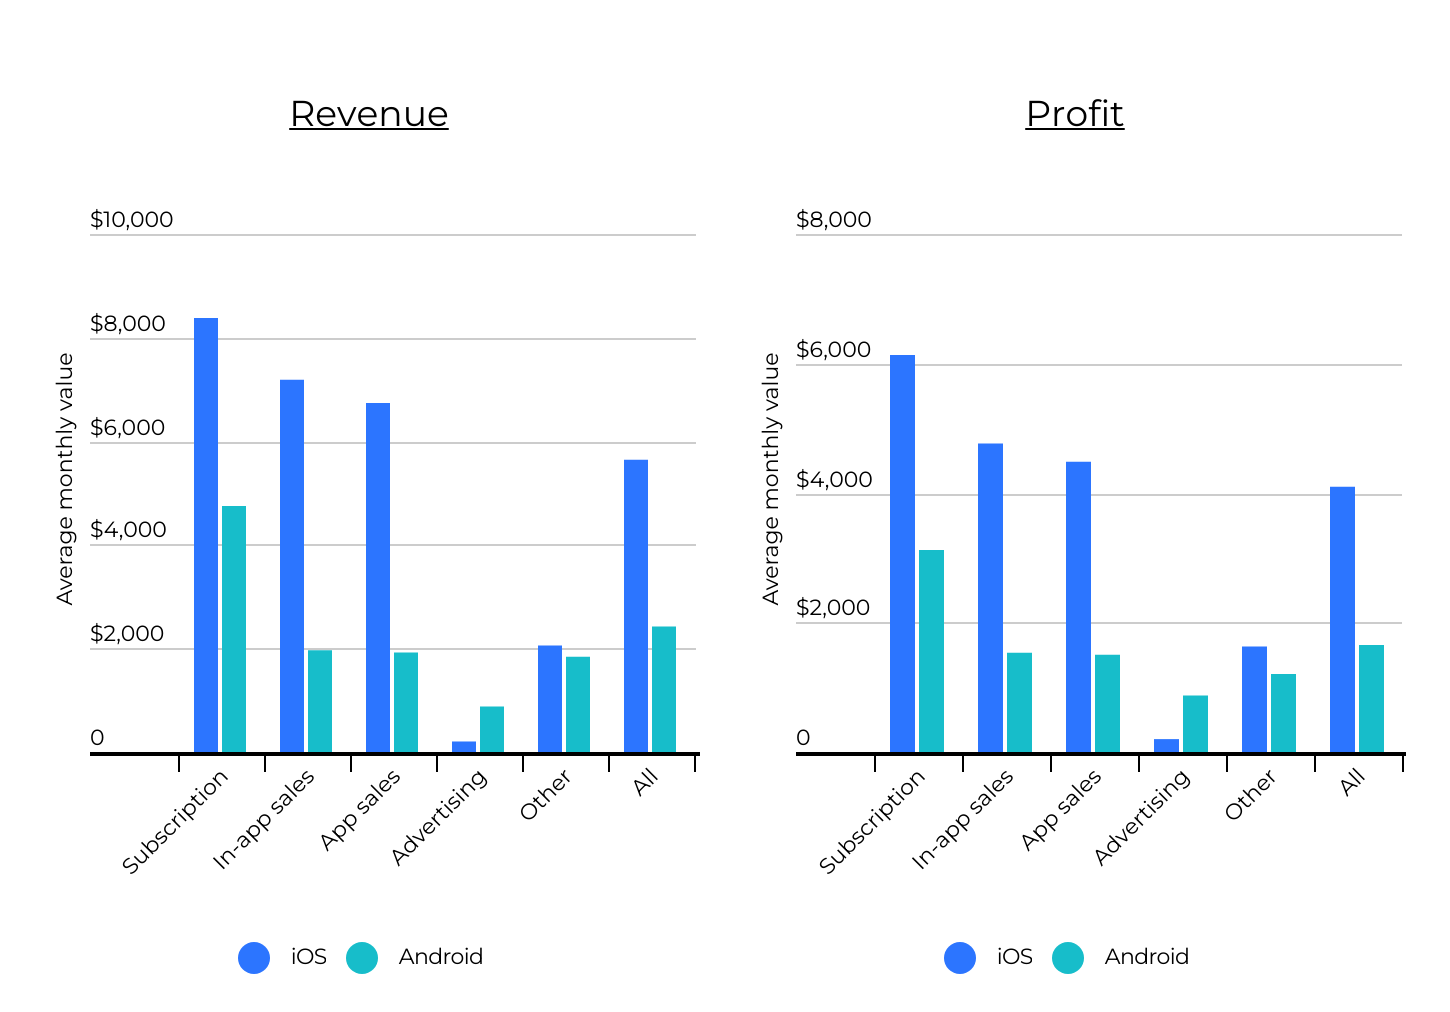
Source: Flippa marketplace transactions (2022–2023) | Image Credit: Flippa
There is a large disparity in financial performance between iOS and Android apps, with iOS apps boasting average monthly revenue and profit of $5,644 and $4,096, respectively, in contrast to Android’s $2,423 and $1,651. This pattern holds true across all monetization models, except for advertising, where Android apps report higher revenue and profit figures than their iOS counterparts.
The substantial variance in profitability between iOS and Android apps can be attributed to a number of factors. First, iOS devices are typically associated with higher-income demographics. Because of this, users of iOS apps tend to possess greater purchasing power and exhibit a propensity to spend more on subscriptions, app purchases, and in-app transactions compared to Android users. Additionally, Apple’s App Store places a strong emphasis on stringent guidelines, security measures, and uniformity in financial transactions across apps. This environment instills a sense of trust among iOS users, leading to a higher average revenue per user.
Lastly, the Android ecosystem is marked by significant fragmentation due to the sheer number of unique devices and screen sizes. This fragmentation poses a considerable challenge for developers in ensuring app functionality across such a wide range of hardware. Consequently, developers may find themselves confronted with the dilemma of compromising user experience on certain devices or spending time building multiple apps tailored to different device specifications. Combined, these factors contribute to the average iOS app earning more than twice what the average Android app brings in.
Industry Focus
Mobile app developers find financial success across a diverse range of sectors
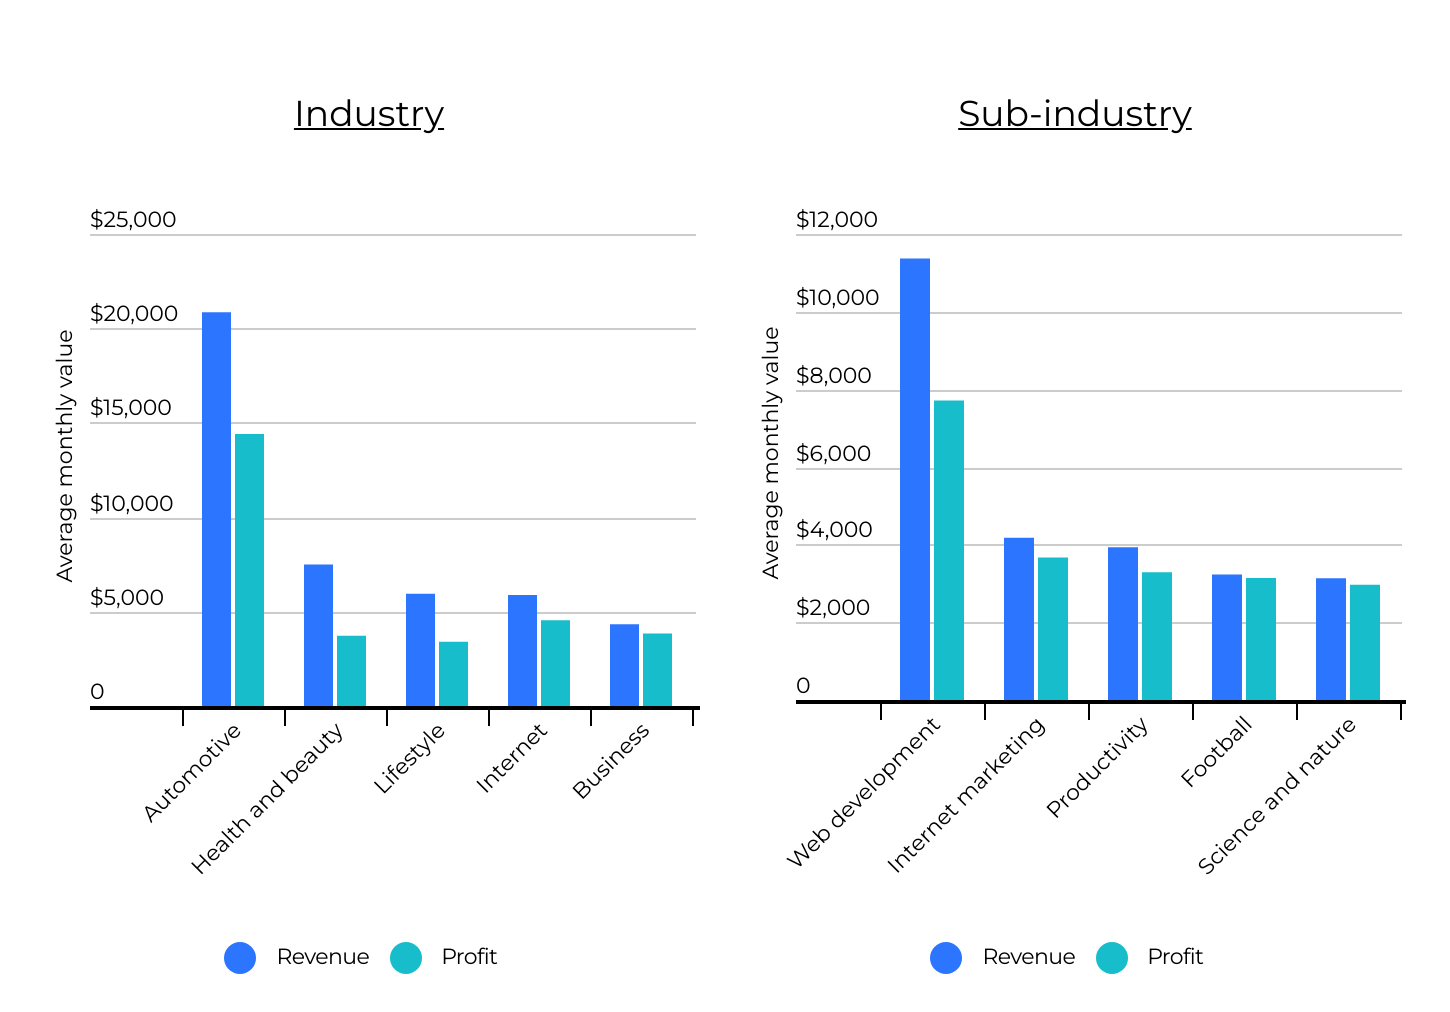
Source: Flippa marketplace transactions (2022–2023) | Image Credit: Flippa
The most lucrative industries and sub-industries for app developers reflect a number of important digital and economic trends that have emerged in recent years. For instance, the surge in automobile prices since 2021, coupled with sustained high costs, has prompted prospective buyers to explore a broader array of online options for better deals. Consequently, mobile apps in the automotive category have experienced remarkable financial success, boasting an average monthly revenue of $20,862.
Likewise, the health and beauty sector—encompassing a diverse range of home fitness, mental health, nutrition, and other wellness-focused apps that have risen in popularity in recent times—emerged as the second most lucrative category for mobile app businesses, with an average monthly revenue of $7,493. Following closely behind were lifestyle apps ($5,939), internet apps ($5,882), and business apps ($4,331).
Digging deeper into sub-industries, business-focused apps claimed the top three positions in terms of average monthly revenue. Web development apps led the pack with an average monthly revenue of $11,368, followed by internet marketing apps at $4,177, and productivity apps at $3,932. Other notable performing sub-industries included football, science, and nature.
Methodology

Photo Credit: dotshock / Shutterstock
The data used in this study is based on profitable mobile application businesses listed on the Flippa marketplace between 2022 and 2023. All data shown are monthly figures.
For complete results, see How Much Do App Developers Make? on Flippa.