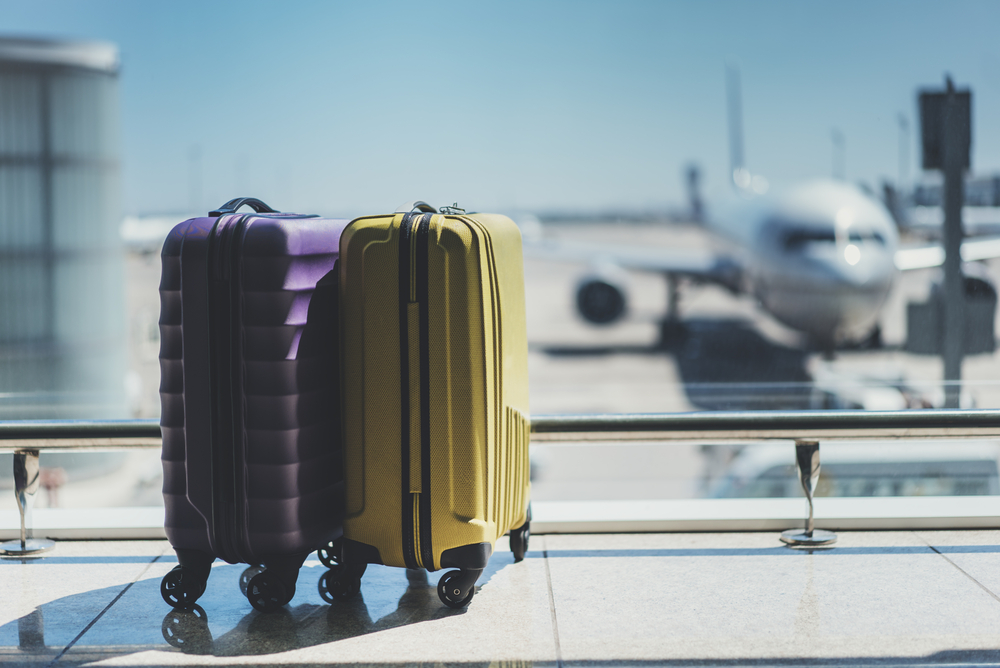
Photo Credit: ImYanis / Shutterstock
The COVID-19 pandemic has been tough on many sectors of the economy, but the travel and tourism industries have been among the hardest-hit.
In the spring and early summer of 2020, widespread shutdowns kept many people at home in efforts to stop the spread of COVID-19. While these restrictions were relaxed over the course of the year, making it easier to travel, ongoing concerns about the virus continued to deter travel. And in 2021, COVID-19 vaccines became widely available, but the emergence of the Delta variant created new hesitation around travel. The economic impact has been profound: travel spending in the U.S. declined by 42%—nearly $500 billion—from 2019 to 2020, according to the U.S. Travel Association.
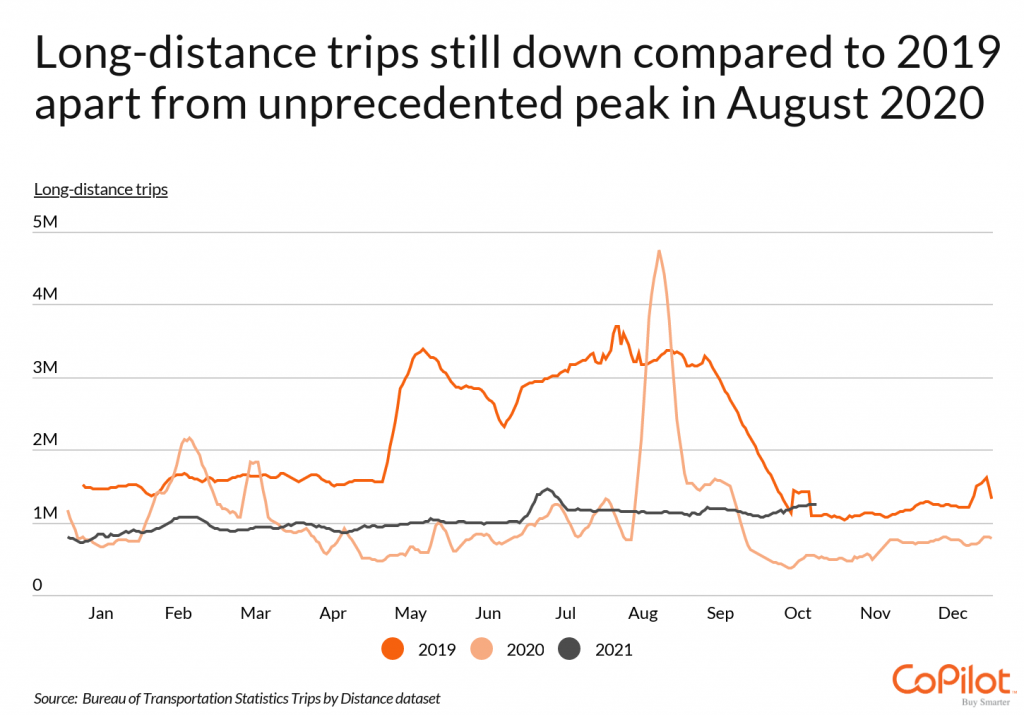
Another way to illustrate the impacts of COVID-19 is in the volume of long-distance trips (defined as those greater than 500 miles) taken over the last three years. The last full year before the pandemic, 2019, demonstrated a typical seasonal pattern, with long-distance trips averaging more than 3 million per day in the summer months and holding steady between 1 and 2 million for the rest of the year. In 2020, the number of long-distance trips fell off when COVID-19 emerged in the spring and stayed under 1 million for most of the year, outside of an unusual spike to nearly 5 million daily long distance trips in August of 2020. This year, the numbers have hovered around 1 million throughout the year.
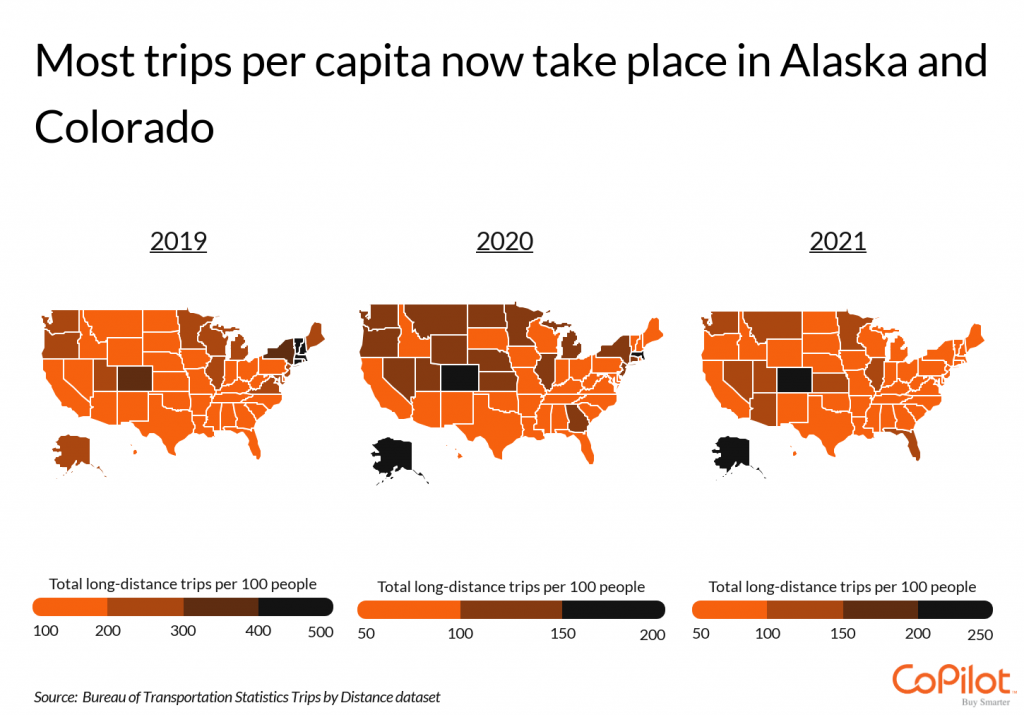
Sustained decreases in the volume of travel are most worrisome for states that depend heavily on tourism and travel as an economic driver. One example is Maine. The state that calls itself “Vacationland” saw 3.5 million long-distance trips through the first nine months of 2019, but only around 550,000 over the same period in 2021. Other states in the Northeast were also similarly affected: the six states making up New England were also the six states with the largest percentage decline in long-distance trips from 2019 to 2021. However, some other tourist-heavy states have escaped such stark declines. Hawaii, Arizona, and Florida lead all states in the travel recovery, with trip volume in 2021 approaching or surpassing pre-pandemic 2019 levels.
Data on the number of long-distance trips (longer than 500 miles) are from the Bureau of Transportation Statistics. To identify states where travel has made a comeback in 2021, researchers at CoPilot looked at locations with the greatest percentage growth in long-distance trips (at least 500 miles) between 2020 and 2021. The data used is for January through September due to data availability.
Here are the states where travel has made a comeback in 2021.
States Where Travel Has Made a Comeback

Photo Credit: Oleg Podzorov / Shutterstock
10. Illinois
- Percentage change in long-distance trips (2020–2021): +3.9%
- Percentage change in long-distance trips (2019–2021): -51.1%
- Total change in long-distance trips (2020–2021): +582,737
- Total change in long-distance trips (2019–2021): -16,196,767
- Total long-distance trips (2021): 15,528,380
- Total long-distance trips (2020): 14,945,643
- Total long-distance trips (2019): 31,725,147

Photo Credit: yhelfman / Shutterstock
9. California
- Percentage change in long-distance trips (2020–2021): +5.6%
- Percentage change in long-distance trips (2019–2021): -52.2%
- Total change in long-distance trips (2020–2021): +1,742,254
- Total change in long-distance trips (2019–2021): -35,862,308
- Total long-distance trips (2021): 32,842,146
- Total long-distance trips (2020): 31,099,892
- Total long-distance trips (2019): 68,704,455

Photo Credit: Virrage Images / Shutterstock
8. Nevada
- Percentage change in long-distance trips (2020–2021): +5.8%
- Percentage change in long-distance trips (2019–2021): -31.4%
- Total change in long-distance trips (2020–2021): +185,472
- Total change in long-distance trips (2019–2021): -1,549,442
- Total long-distance trips (2021): 3,391,790
- Total long-distance trips (2020): 3,206,318
- Total long-distance trips (2019): 4,941,232

Photo Credit: Mihai_Andritoiu / Shutterstock
7. Texas
- Percentage change in long-distance trips (2020–2021): +6.4%
- Percentage change in long-distance trips (2019–2021): -17.7%
- Total change in long-distance trips (2020–2021): +1,646,690
- Total change in long-distance trips (2019–2021): -5,874,329
- Total long-distance trips (2021): 27,339,248
- Total long-distance trips (2020): 25,692,558
- Total long-distance trips (2019): 33,213,577

Photo Credit: Marcus Biastock / Shutterstock
6. Alaska
- Percentage change in long-distance trips (2020–2021): +17.3%
- Percentage change in long-distance trips (2019–2021): +7.1%
- Total change in long-distance trips (2020–2021): +279,818
- Total change in long-distance trips (2019–2021): +125,063
- Total long-distance trips (2021): 1,895,830
- Total long-distance trips (2020): 1,616,012
- Total long-distance trips (2019): 1,770,767

Photo Credit: Sean Pavone / Shutterstock
5. Colorado
- Percentage change in long-distance trips (2020–2021): +17.8%
- Percentage change in long-distance trips (2019–2021): -27.0%
- Total change in long-distance trips (2020–2021): +2,072,358
- Total change in long-distance trips (2019–2021): -5,068,895
- Total long-distance trips (2021): 13,742,993
- Total long-distance trips (2020): 11,670,635
- Total long-distance trips (2019): 18,811,888

Photo Credit: Sean Pavone / Shutterstock
4. Oklahoma
- Percentage change in long-distance trips (2020–2021): +18.5%
- Percentage change in long-distance trips (2019–2021): -18.2%
- Total change in long-distance trips (2020–2021): +367,494
- Total change in long-distance trips (2019–2021): -522,056
- Total long-distance trips (2021): 2,354,796
- Total long-distance trips (2020): 1,987,302
- Total long-distance trips (2019): 2,876,852

Photo Credit: CHARLES MORRA / Shutterstock
3. Florida
- Percentage change in long-distance trips (2020–2021): +20.0%
- Percentage change in long-distance trips (2019–2021): +4.1%
- Total change in long-distance trips (2020–2021): +4,122,200
- Total change in long-distance trips (2019–2021): +967,727
- Total long-distance trips (2021): 24,699,749
- Total long-distance trips (2020): 20,577,549
- Total long-distance trips (2019): 23,732,022

Photo Credit: Gregory E. Clifford / Shutterstock
2. Arizona
- Percentage change in long-distance trips (2020–2021): +21.2%
- Percentage change in long-distance trips (2019–2021): -21.8%
- Total change in long-distance trips (2020–2021): +1,496,989
- Total change in long-distance trips (2019–2021): -2,383,086
- Total long-distance trips (2021): 8,569,143
- Total long-distance trips (2020): 7,072,154
- Total long-distance trips (2019): 10,952,229

Photo Credit: Izabela23 / Shutterstock
1. Hawaii
- Percentage change in long-distance trips (2020–2021): +23.3%
- Percentage change in long-distance trips (2019–2021): +0.4%
- Total change in long-distance trips (2020–2021): +243,312
- Total change in long-distance trips (2019–2021): +5,451
- Total long-distance trips (2021): 1,285,846
- Total long-distance trips (2020): 1,042,534
- Total long-distance trips (2019): 1,280,395
Methodology & Detailed Findings
Data on the number of long-distance trips (longer than 500 miles) are from the Bureau of Transportation Statistics Trips by Distance dataset, while data on population is from the U.S. Census Bureau American Community Survey. To identify states where travel has made a comeback in 2021, researchers looked at locations with the greatest percentage growth in long-distance trips (at least 500 miles) between 2020 and 2021. The data used is for January through September due to data availability. A more comprehensive description of the metrics and methods used to define a trip can be found here.