
Photo Credit: Rasstock / Shutterstock
One of the most prominent and likely enduring changes brought about by the COVID-19 pandemic has been the rapid shift towards new technologies that facilitate remote communication, entertainment, learning, and work. While older Americans generally have lower rates of technology adoption than their younger counterparts—for example, 78% of 65-and-over households have internet access compared to 89% of households overall—they are more digitally connected today than ever before.
Technology has enabled seniors to endure some of the most trying aspects of the COVID-19 pandemic, by allowing them to stay in touch with others during isolation and providing them with access to critical services such as grocery delivery and telehealth visits. A recent AARP report found that technology spending among older adults nearly tripled during the pandemic, and smartphones were one of the top three tech purchases for that demographic. AARP also reported that significantly more seniors texted, used video chat, and emailed during the pandemic than they did before.
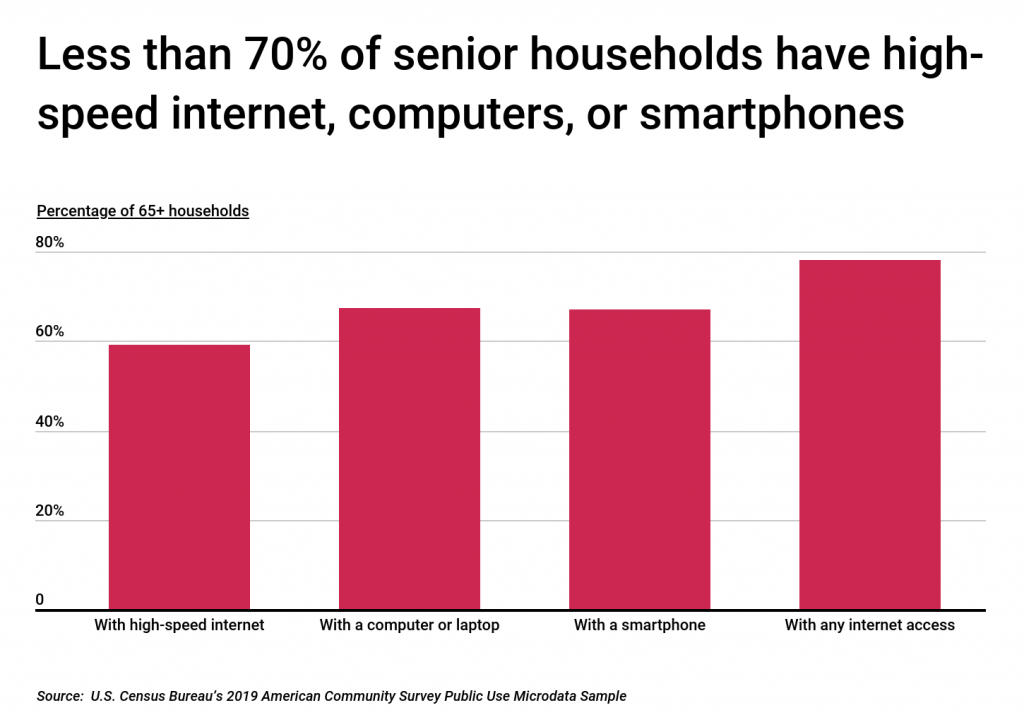
While 78% of seniors have some form of internet access, just less than 60% have high-speed internet subscriptions, and 67% each have a computer and smartphone, according to the most recent Census Bureau statistics. These numbers vary widely by location and socioeconomic status. For example, research points to a strong rural-metropolitan digital divide among older Americans. Likewise, extensive research points to low rates of technology adoption in less-educated and low-income senior households.
To find the locations with the most digitally-connected seniors, researchers at HotDog.com analyzed data from the U.S. Census Bureau and created a composite score based on the following factors:
- Percentage of 65+ households with high-speed internet
- Percentage of 65+ households with a computer or laptop
- Percentage of 65+ households with a smartphone
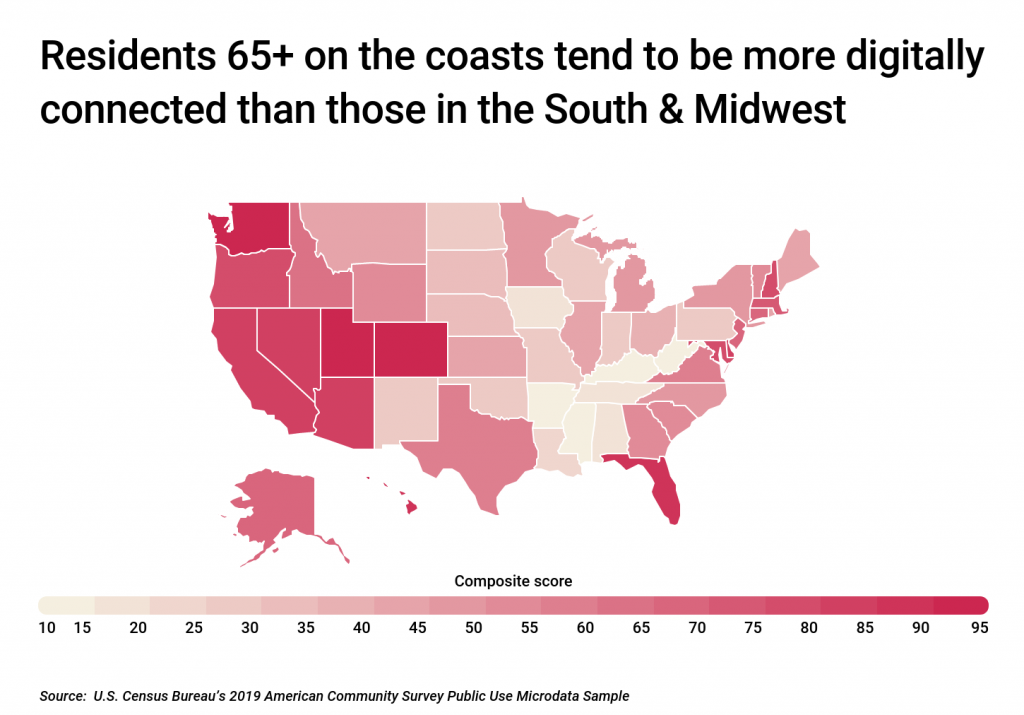
At the regional level, seniors living on the coasts and in the Mountain West tend to be more digitally connected than those living in the South and Midwest. Utah ranks highest among all states, where 65% of senior households have access to high-speed internet, 80% have a computer or laptop, and 76% have a smartphone. Nationally, 59% of senior households have access to high-speed internet, and 67% each have computers and smartphones. On the opposite end of the spectrum, West Virginia’s 65-and-over population ranks last among all states when it comes to digital connectivity. Just 53% of senior households in West Virginia have high-speed internet, 56% have computers, and 53% have smartphones.
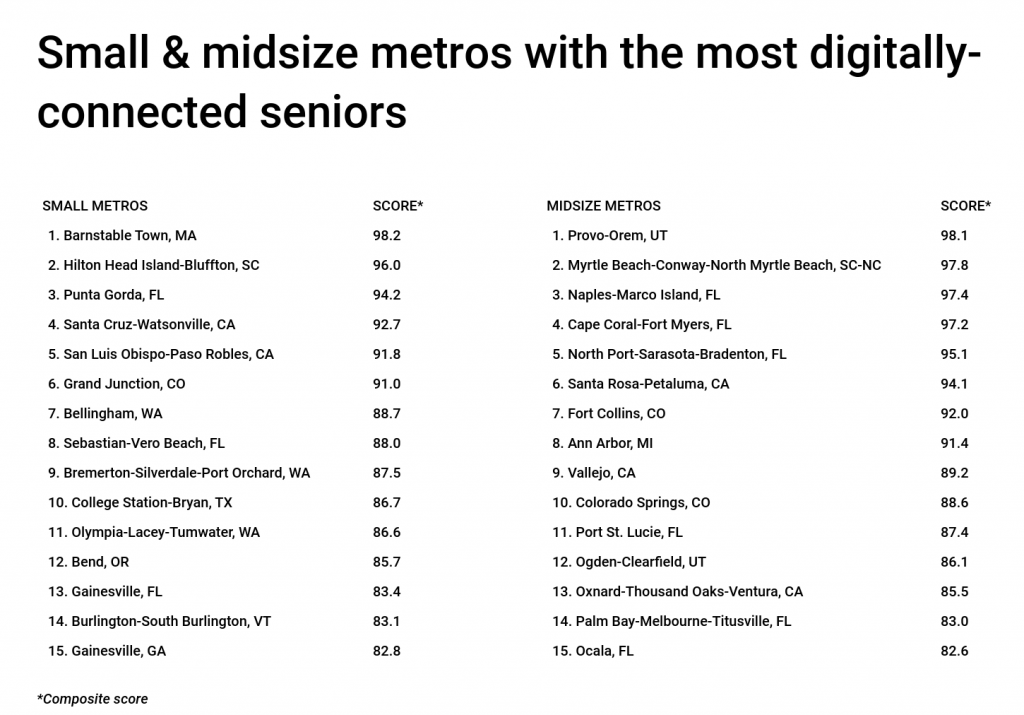
Similar trends hold true at the local level, with many metropolitan areas in California, Colorado, Utah, and Florida topping the list. In general, more affluent cities with strong economies report the highest rates of technology use among the 65-and-over population. Here are the U.S. metros with the most digitally-connected seniors.
Large Metros With the Most Digitally-Connected Seniors

Photo Credit: ESB Professional / Shutterstock
15. Atlanta-Sandy Springs-Alpharetta, GA
- Composite score: 78.5
- Percentage of 65+ households with high-speed internet: 65.6%
- Percentage of 65+ households with a computer or laptop: 72.5%
- Percentage of 65+ households with a smartphone: 75.4%

Photo Credit: CHARLES MORRA / Shutterstock
14. Jacksonville, FL
- Composite score: 78.9
- Percentage of 65+ households with high-speed internet: 64.2%
- Percentage of 65+ households with a computer or laptop: 74.1%
- Percentage of 65+ households with a smartphone: 75.8%

Photo Credit: CK Foto / Shutterstock
13. Dallas-Fort Worth-Arlington, TX
- Composite score: 79.9
- Percentage of 65+ households with high-speed internet: 64.3%
- Percentage of 65+ households with a computer or laptop: 73.3%
- Percentage of 65+ households with a smartphone: 77.5%

Photo Credit: Sean Pavone / Shutterstock
12. Portland-Vancouver-Hillsboro, OR-WA
- Composite score: 81.5
- Percentage of 65+ households with high-speed internet: 66.8%
- Percentage of 65+ households with a computer or laptop: 77.4%
- Percentage of 65+ households with a smartphone: 73.3%

Photo Credit: Checubus / Shutterstock
11. Seattle-Tacoma-Bellevue, WA
- Composite score: 82.6
- Percentage of 65+ households with high-speed internet: 70.4%
- Percentage of 65+ households with a computer or laptop: 75.7%
- Percentage of 65+ households with a smartphone: 72.5%
Photo Credit: Sean Pavone / Shutterstock
10. Orlando-Kissimmee-Sanford, FL
- Composite score: 83.4
- Percentage of 65+ households with high-speed internet: 68.3%
- Percentage of 65+ households with a computer or laptop: 72.6%
- Percentage of 65+ households with a smartphone: 76.5%

Photo Credit: Dancestrokes / Shutterstock
9. San Diego-Chula Vista-Carlsbad, CA
- Composite score: 84.4
- Percentage of 65+ households with high-speed internet: 68.5%
- Percentage of 65+ households with a computer or laptop: 75.3%
- Percentage of 65+ households with a smartphone: 75.4%

Photo Credit: Sean Pavone / Shutterstock
8. Denver-Aurora-Lakewood, CO
- Composite score: 85.2
- Percentage of 65+ households with high-speed internet: 69.2%
- Percentage of 65+ households with a computer or laptop: 78.6%
- Percentage of 65+ households with a smartphone: 72.9%

Photo Credit: Sean Pavone / Shutterstock
7. Salt Lake City, UT
- Composite score: 85.6
- Percentage of 65+ households with high-speed internet: 65.9%
- Percentage of 65+ households with a computer or laptop: 77.4%
- Percentage of 65+ households with a smartphone: 76.8%

Photo Credit: Andrew Zarivny / Shutterstock
6. Sacramento-Roseville-Folsom, CA
- Composite score: 86.5
- Percentage of 65+ households with high-speed internet: 66.6%
- Percentage of 65+ households with a computer or laptop: 78.2%
- Percentage of 65+ households with a smartphone: 75.8%

Photo Credit: yhelfman / Shutterstock
5. San Francisco-Oakland-Berkeley, CA
- Composite score: 86.7
- Percentage of 65+ households with high-speed internet: 69.8%
- Percentage of 65+ households with a computer or laptop: 74.5%
- Percentage of 65+ households with a smartphone: 76.2%

Photo Credit: Gregory E. Clifford / Shutterstock
4. Phoenix-Mesa-Chandler, AZ
- Composite score: 87.0
- Percentage of 65+ households with high-speed internet: 66.5%
- Percentage of 65+ households with a computer or laptop: 78.0%
- Percentage of 65+ households with a smartphone: 77.1%
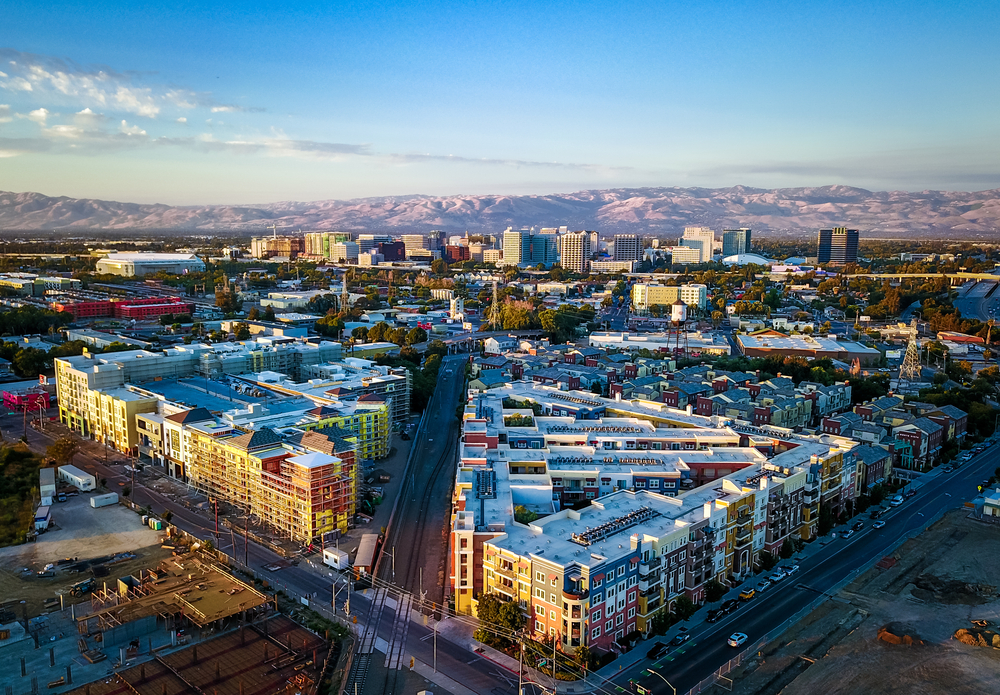
Photo Credit: Uladzik Kryhin / Shutterstock
3. San Jose-Sunnyvale-Santa Clara, CA
- Composite score: 88.2
- Percentage of 65+ households with high-speed internet: 71.5%
- Percentage of 65+ households with a computer or laptop: 76.0%
- Percentage of 65+ households with a smartphone: 75.6%

Photo Credit: f11photo / Shutterstock
2. Washington-Arlington-Alexandria, DC-VA-MD-WV
- Composite score: 90.9
- Percentage of 65+ households with high-speed internet: 71.4%
- Percentage of 65+ households with a computer or laptop: 78.9%
- Percentage of 65+ households with a smartphone: 75.6%

Photo Credit: Sean Pavone / Shutterstock
1. Austin-Round Rock-Georgetown, TX
- Composite score: 93.2
- Percentage of 65+ households with high-speed internet: 68.7%
- Percentage of 65+ households with a computer or laptop: 79.6%
- Percentage of 65+ households with a smartphone: 79.1%
Detailed Findings & Methodology
To find the U.S. metropolitan areas with the most digitally-connected seniors, researchers at HotDog.com analyzed data from the U.S. Census Bureau’s 2019 American Community Survey Public Use Microdata Sample and created a composite score based on the following factors:
- Percentage of 65+ households with high-speed internet
- Percentage of 65+ households with a computer or laptop
- Percentage of 65+ household with a smartphone
To improve relevance, only metropolitan areas with at least 100,000 people were included in the analysis. Additionally, metro areas were grouped into the following cohorts based on population size: small metros: 100,000–349,999; midsize metros: 350,000–999,999; large metros: 1,000,000 or more.