Photo Credit: Nikolay Skatin / Shutterstock
The real estate market over the past year has offered few deals and discounts for homebuyers. With the inventory of existing homes having reached historic lows last fall and new construction still slowed by supply chain and labor challenges, a growing number of buyers have been competing for a limited number of homes. This has driven home prices to record heights, with some of the fastest rates of price growth on record.
There are recent signs that these trends are slowing down as the market has moved into the historically less active fall and winter months. Inventory has rebounded to pre-pandemic levels, offering buyers more options. The length of time a listing spends on the market is rising. And the pace of growth in home prices is also beginning to slow.
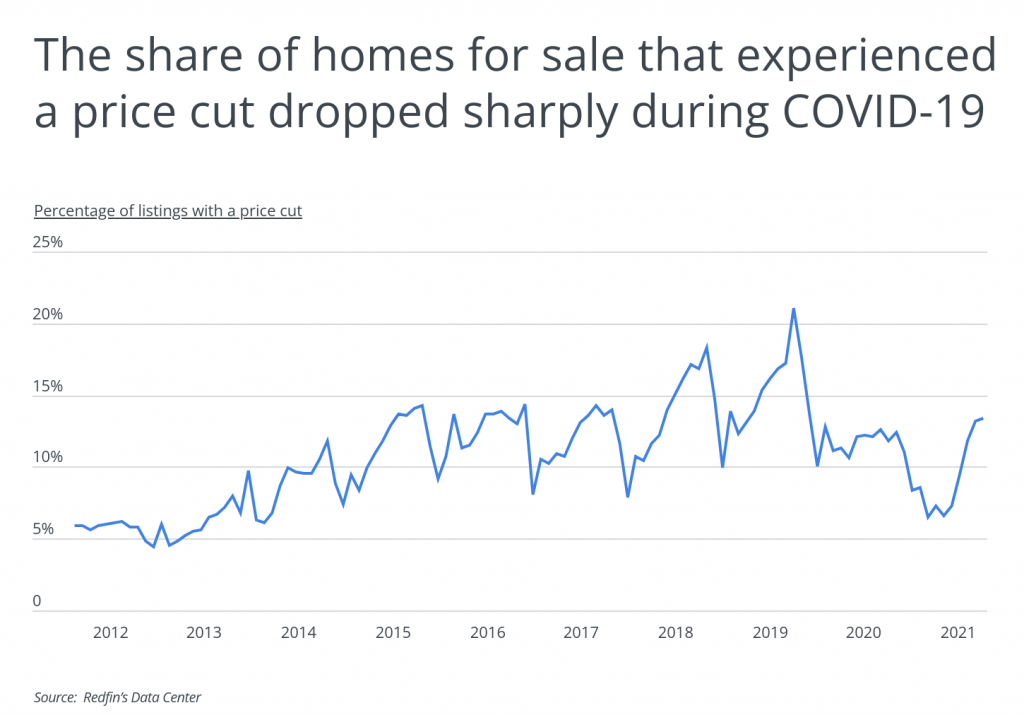
Another encouraging sign is the share of homes for sale that have seen their prices cut. When the market was at its most competitive, it was common for many homes to sell well above their asking price and few homes to see their price reduced. According to data from Redfin, the share of homes experiencing a price cut reached a low of 6.5% in February 2021, but that figure began to climb upward in May, and by September of this year, 13.4% of homes saw a price decrease.
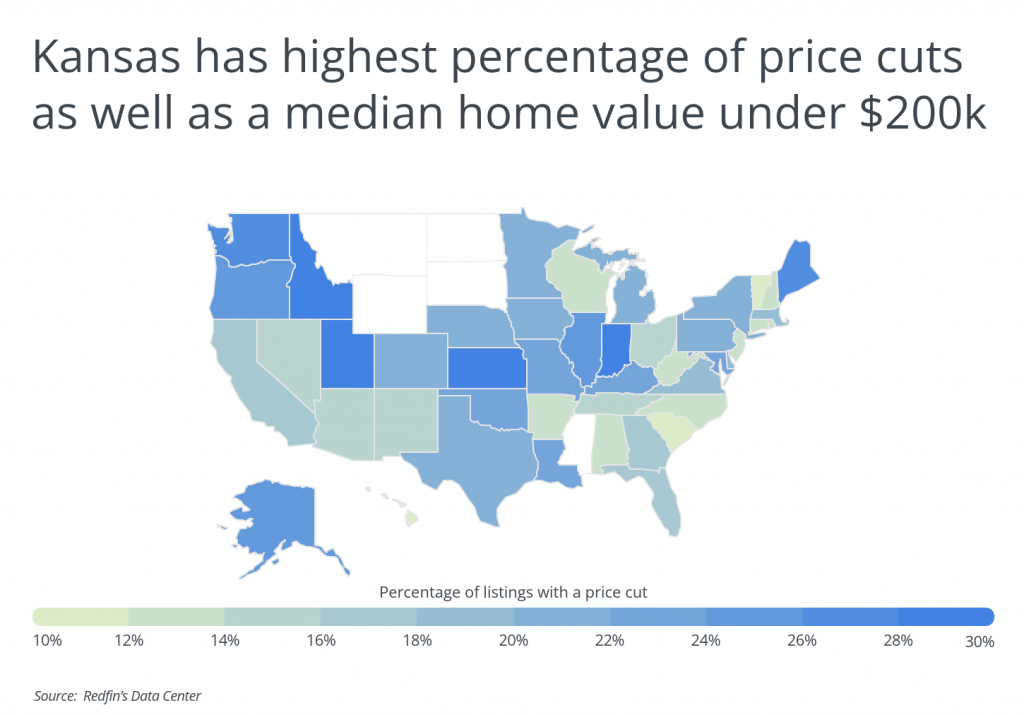
Some markets have offered a greater likelihood of price cuts on listings than others. Kansas led all states in the share of homes with a price decrease in 2021 at 30.2%—the only state with a percentage above 30% for the year. These discounts came on top of already affordable prices for real estate, as the median home price in Kansas is less than $200,000. At the other end of the spectrum, Hawaii has one of the highest median home prices in the U.S. but only saw 9.3% of listings receive a discount this year.
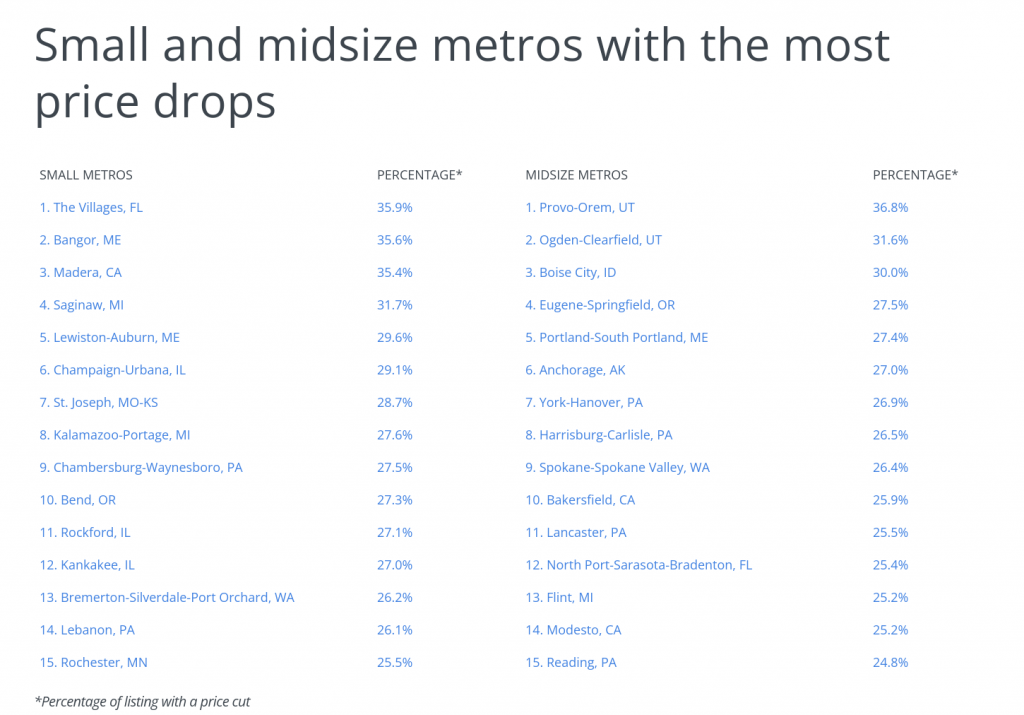
Price decreases at the metro level are starting to show up in a variety of locales. As buyers show signs of fatigue from the competitive market and greater concerns about affordability as prices rise, decreases are becoming more common across the board. The metros with the most price decreases this year include fast-growing and expensive metros like Seattle, growing but affordable markets like Fresno, and slow-growth markets like Buffalo.
The data used in this analysis is from Redfin and Zillow. To determine the locations where the most homes experienced a price cut, researchers at Porch calculated the percentage of active listings with a price cut in each market, accounting for the first nine months of 2021. In the event of a tie, the location with the lower average sale-to-list price ratio was ranked higher. Researchers also included each location’s median home price, which is the most recent Zillow Home Value Index, and its change was calculated between October 2020 and 2021. Only metropolitan statistical areas and states with complete data from both Redfin and Zillow were included in the analysis.
Here are the metros where the most homes experienced a price cut in 2021.
Large Metros With the Most Price Drops

Photo Credit: Sean Pavone / Shutterstock
15. Oklahoma City, OK
- Percentage of listings with a price cut: 23.6%
- Average sale-to-list price ratio: 100.0%
- Median home price: $192,346
- Annual percentage change in median home price: +14.3%

Photo Credit: Sergey Novikov / Shutterstock
14. Buffalo-Cheektowaga, NY
- Percentage of listings with a price cut: 24.1%
- Average sale-to-list price ratio: 105.9%
- Median home price: $225,277
- Annual percentage change in median home price: +20.1%

Photo Credit: Songquan Deng / Shutterstock
13. Orlando-Kissimmee-Sanford, FL
- Percentage of listings with a price cut: 24.5%
- Average sale-to-list price ratio: 99.2%
- Median home price: $328,555
- Annual percentage change in median home price: +20.3%

Photo Credit: Sean Pavone / Shutterstock
12. Baltimore-Columbia-Towson, MD
- Percentage of listings with a price cut: 25.1%
- Average sale-to-list price ratio: 100.8%
- Median home price: $349,655
- Annual percentage change in median home price: +12.8%

Photo Credit: Tomas Simkus / Shutterstock
11. Houston-The Woodlands-Sugar Land, TX
- Percentage of listings with a price cut: 25.1%
- Average sale-to-list price ratio: 99.5%
- Median home price: $272,066
- Annual percentage change in median home price: +18.8%

Photo Credit: Sean Pavone / Shutterstock
10. New Orleans-Metairie, LA
- Percentage of listings with a price cut: 25.2%
- Average sale-to-list price ratio: 98.2%
- Median home price: $249,800
- Annual percentage change in median home price: +13.7%

Photo Credit: Valiik30 / Shutterstock
9. Tulsa, OK
- Percentage of listings with a price cut: 26.0%
- Average sale-to-list price ratio: 99.5%
- Median home price: $184,770
- Annual percentage change in median home price: +15.9%

Photo Credit: Andrew Zarivny / Shutterstock
8. Sacramento-Roseville-Folsom, CA
- Percentage of listings with a price cut: 26.1%
- Average sale-to-list price ratio: 103.2%
- Median home price: $567,023
- Annual percentage change in median home price: +24.0%

Photo Credit: f11photo / Shutterstock
7. Seattle-Tacoma-Bellevue, WA
- Percentage of listings with a price cut: 27.2%
- Average sale-to-list price ratio: 105.3%
- Median home price: $695,058
- Annual percentage change in median home price: +21.8%

Photo Credit: Bonnie Fink / Shutterstock
6. Tampa-St. Petersburg-Clearwater, FL
- Percentage of listings with a price cut: 27.7%
- Average sale-to-list price ratio: 99.7%
- Median home price: $316,379
- Annual percentage change in median home price: +28.7%

Photo Credit: Jon Bilous / Shutterstock
5. Portland-Vancouver-Hillsboro, OR-WA
- Percentage of listings with a price cut: 28.5%
- Average sale-to-list price ratio: 103.1%
- Median home price: $532,300
- Annual percentage change in median home price: +19.2%

Photo Credit: photo.ua / Shutterstock
4. Salt Lake City, UT
- Percentage of listings with a price cut: 30.6%
- Average sale-to-list price ratio: 102.9%
- Median home price: $539,824
- Annual percentage change in median home price: +28.4%

Photo Credit: Nicholas Courtney / Shutterstock
3. Denver-Aurora-Lakewood, CO
- Percentage of listings with a price cut: 31.8%
- Average sale-to-list price ratio: 103.5%
- Median home price: $574,734
- Annual percentage change in median home price: +22.0%

Photo Credit: Agnieszka Gaul / Shutterstock
2. Indianapolis-Carmel-Anderson, IN
- Percentage of listings with a price cut: 33.1%
- Average sale-to-list price ratio: 100.6%
- Median home price: $235,663
- Annual percentage change in median home price: +18.1%

Photo Credit: stellamc / Shutterstock
1. Fresno, CA
- Percentage of listings with a price cut: 42.4%
- Average sale-to-list price ratio: 99.9%
- Median home price: $358,255
- Annual percentage change in median home price: +22.7%
Detailed Findings & Methodology
The data used in this analysis is from Redfin’s Data Center and Zillow’s Housing Data. To determine the locations where the most homes experienced a price cut, researchers calculated the percentage of active listings with a price cut in each market. In the event of a tie, the location with the lower average sale-to-list price ratio was ranked higher. These fields were determined using a weighted average of monthly data from 2021 based on the number of homes sold for each location and time period. The median home price field is the most recent Zillow Home Value Index, and its change was calculated between October 2020 and 2021. To improve relevance, only metropolitan areas with at least 100,000 residents were included. Additionally, metros were grouped into cohorts based on population size: small (100,000–349,999), midsize (350,000–999,999), and large (1,000,000 or more). Notably, only metropolitan statistical areas and states with complete data from both Redfin and Zillow were included.


