Photo Credit: Robert Crum / Shutterstock
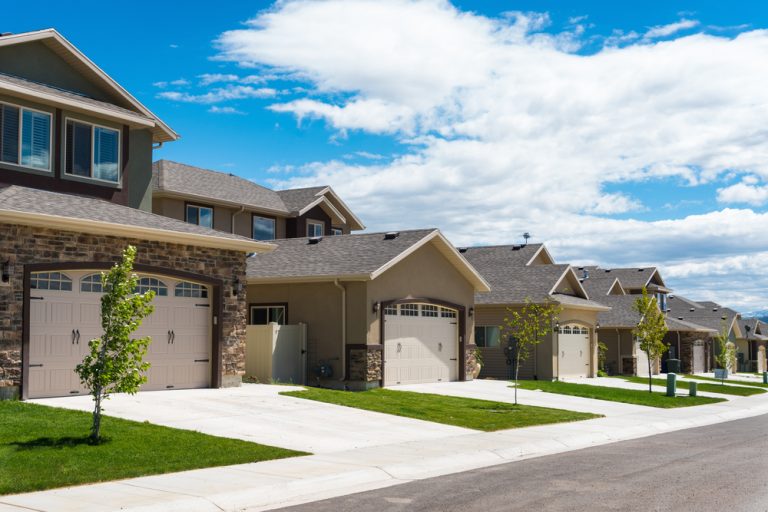
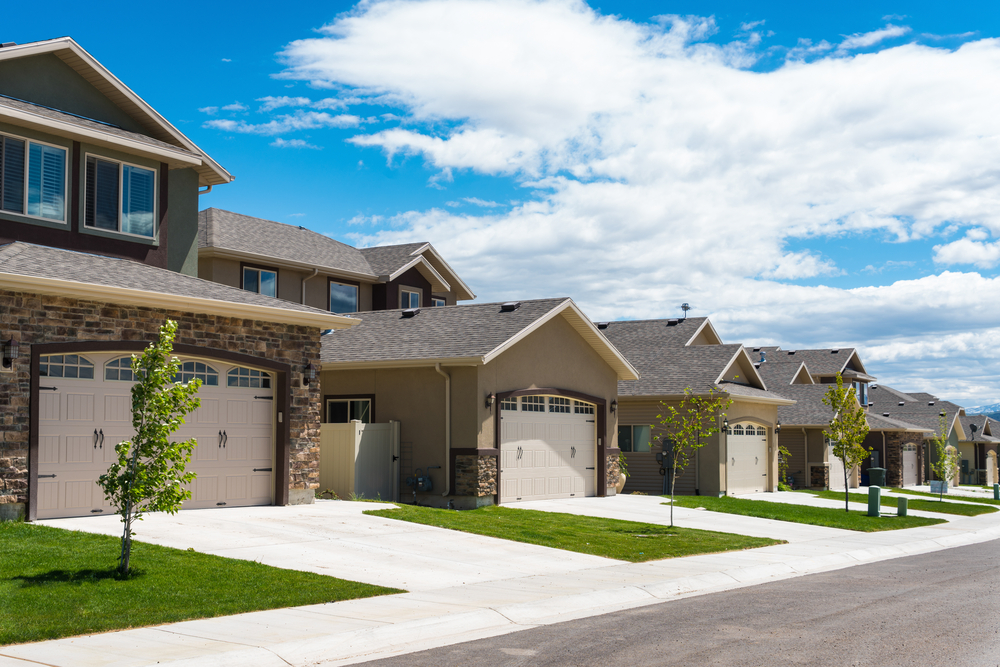
The COVID-19 pandemic has reshaped the real estate market in the U.S. in many ways, changing where families want to live and the types of housing they prefer.
Early on in the pandemic, many families in densely populated urban areas set out for more spacious homes in rural or suburban areas. As more workplaces have adapted to permanent work-from-home or hybrid arrangements, some workers have made the move permanent, preferring space and affordability over proximity to the workplace or other amenities. And these pandemic-induced shifts have accelerated a trend away from cities among the Millennial generation. At ages 25 to 40, Millennials are currently in their peak years for starting or growing a family and are seeking more spacious homes to accommodate that.
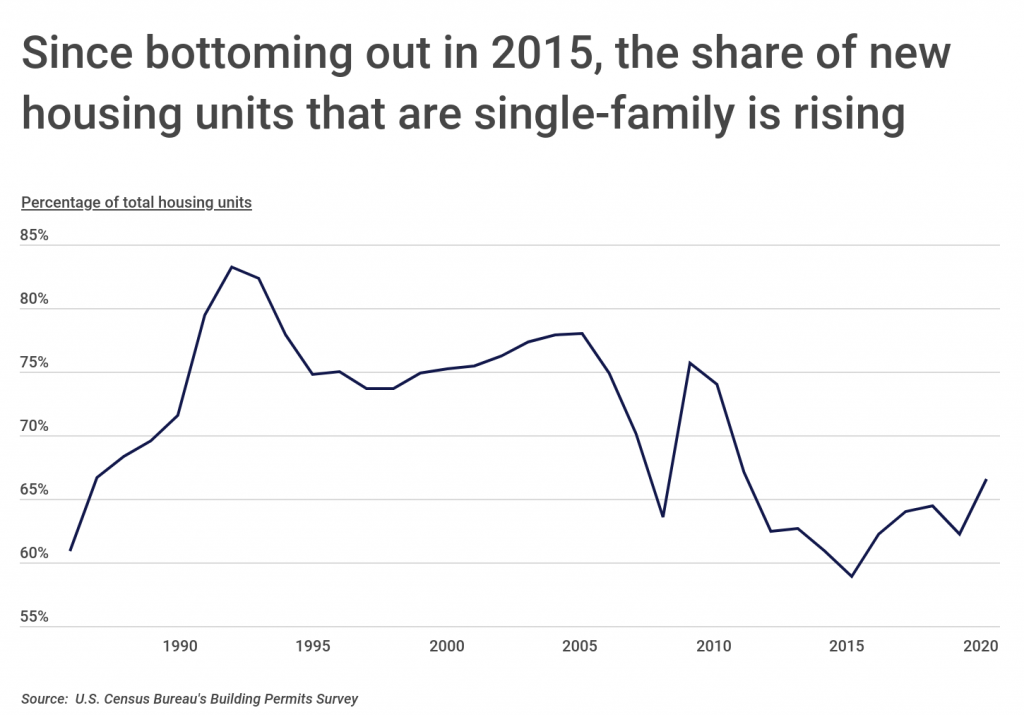
While as many as 89% of homebuyers would prefer a single-family home, these trends run counter to the direction of housing development in recent years. Apartments, multi-family construction, and other denser forms of housing have been presented as more efficient, affordable, and sustainable options than single-family homes. As a result, the share of new housing units authorized by building permits that are single-family dropped from nearly 80% at the peak of the U.S. housing bubble in 2005 to less than 60% ten years later. Recently, however, that share has begun to recover, rising from 62.2% to 66.6% from 2019 to 2020.
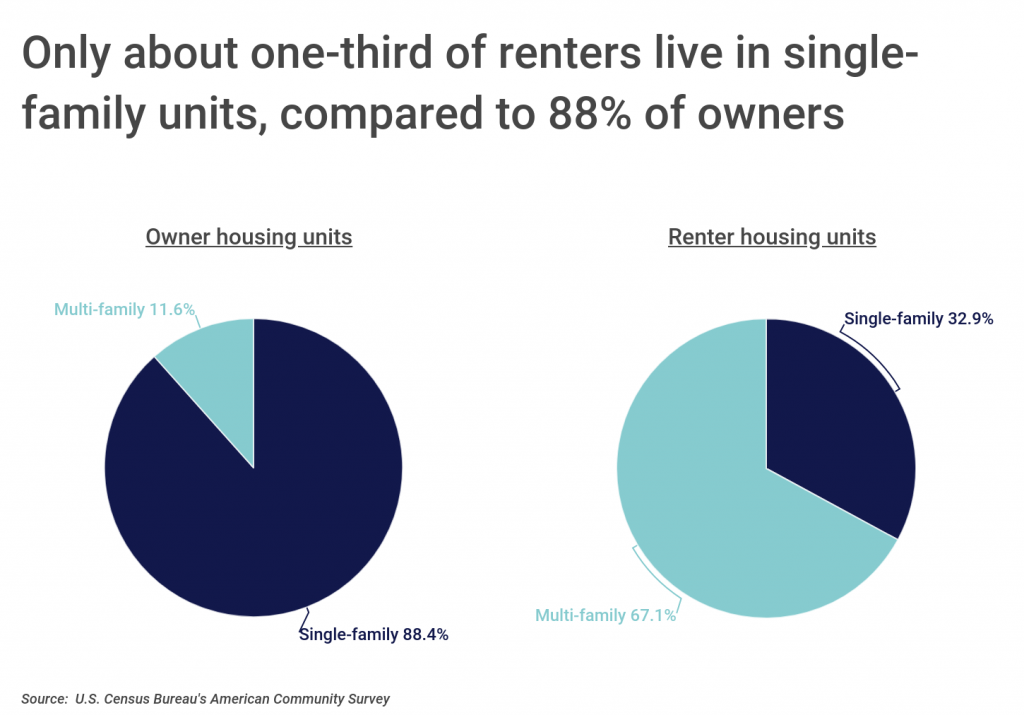
Americans’ preference for single-family homes extends into the rental market as well. More than two-thirds of renters (67.1%) live in multi-family units, compared to just 11.6% of owners. But during the pandemic, demand for single-family rentals has increased as well, which has pushed rents higher. According to CoreLogic, single-family rents rose 10.2% from September 2020 to September 2021 behind a surging demand for single-family properties, especially from those who have been priced out of the hot residential real estate market.
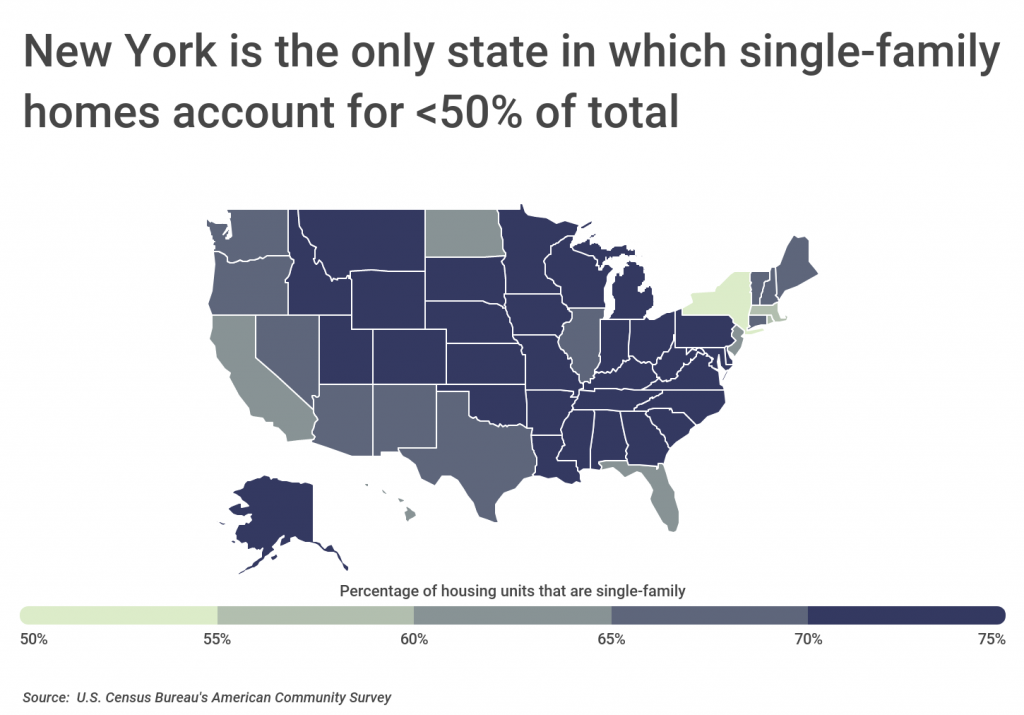
But while adequate supply of single-family homes is a current challenge, single-family units remain the norm in most places. Only one state—New York—has a majority of its housing in the form of multi-family units, with only 46.6% single-family units. In contrast, more than half of all states have 70% or more single-family units, led by Indiana and Kansas at 78.5% apiece.
In general, single-family homes tend to be more common in the Midwest and South and less common on the coasts. As a result, most of the large cities (>350,000 residents) with the most single-family homes are located in Midwestern and Southern states. But somewhat surprisingly, the large U.S. city with the greatest share of single-family homes is Bakersfield, CA, with 76.2% single-family units—well above the overall share for California, 64.7%, which ranks 43rd among states.
The data used in this analysis is from the U.S. Census Bureau. To determine the locations with the most single-family homes, researchers at Construction Coverage calculated the percentage of existing housing units that are single-family, defined as “single unit, detached” or “single unit, attached.” In the event of a tie, the location with the higher percentage of owner-occupied housing units that are single-family was ranked higher. Researchers also included statistics on renter-occupied housing units as well.
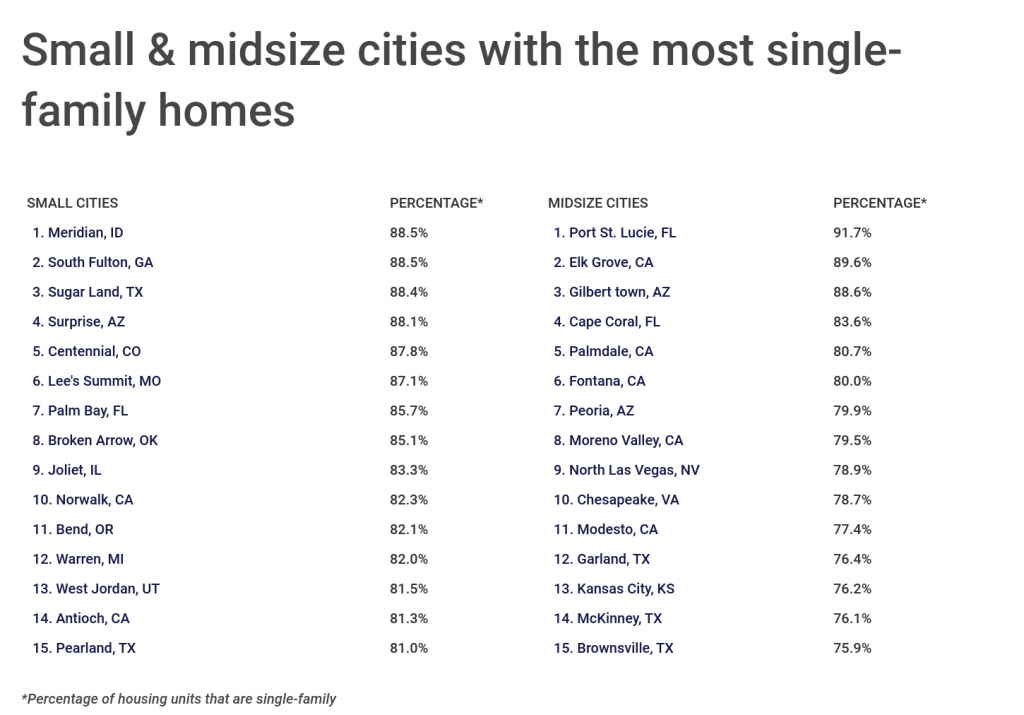
Here are the cities with the most single-family homes.
Large Cities With the Most Single-Family Homes

Photo Credit: Sean Pavone / Shutterstock
15. Kansas City, MO
- Percentage of housing units that are single-family: 67.4%
- Percentage of owner housing units that are single-family: 95.1%
- Percentage of renter housing units that are single-family: 36.5%
- Total single-family housing units: 141,476
- Total housing units: 209,768

Photo Credit: Sean Pavone / Shutterstock
14. Las Vegas, NV
- Percentage of housing units that are single-family: 67.6%
- Percentage of owner housing units that are single-family: 93.0%
- Percentage of renter housing units that are single-family: 39.6%
- Total single-family housing units: 159,390
- Total housing units: 235,628

Photo Credit: DomVisuals / Shutterstock
13. Omaha, NE
- Percentage of housing units that are single-family: 68.6%
- Percentage of owner housing units that are single-family: 96.8%
- Percentage of renter housing units that are single-family: 29.0%
- Total single-family housing units: 129,534
- Total housing units: 188,824

Photo Credit: Sean Pavone / Shutterstock
12. Memphis, TN
- Percentage of housing units that are single-family: 69.1%
- Percentage of owner housing units that are single-family: 95.6%
- Percentage of renter housing units that are single-family: 46.2%
- Total single-family housing units: 175,931
- Total housing units: 254,423

Photo Credit: Sean Pavone / Shutterstock
11. Albuquerque, NM
- Percentage of housing units that are single-family: 69.2%
- Percentage of owner housing units that are single-family: 93.2%
- Percentage of renter housing units that are single-family: 33.1%
- Total single-family housing units: 157,279
- Total housing units: 227,179

Photo Credit: Jonny Trego / Shutterstock
10. Louisville/Jefferson County, KY
- Percentage of housing units that are single-family: 69.7%
- Percentage of owner housing units that are single-family: 94.3%
- Percentage of renter housing units that are single-family: 33.3%
- Total single-family housing units: 176,177
- Total housing units: 252,784

Photo Credit: photo.ua / Shutterstock
9. Colorado Springs, CO
- Percentage of housing units that are single-family: 70.0%
- Percentage of owner housing units that are single-family: 94.7%
- Percentage of renter housing units that are single-family: 33.2%
- Total single-family housing units: 132,229
- Total housing units: 188,837
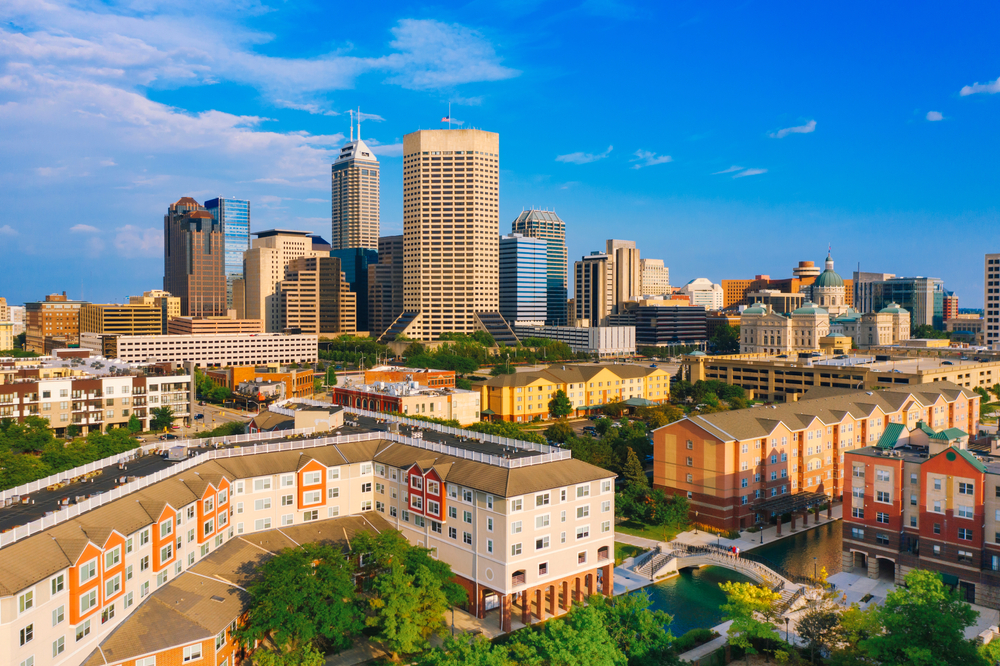
Photo Credit: Agnieszka Gaul / Shutterstock
8. Indianapolis, IN
- Percentage of housing units that are single-family: 70.2%
- Percentage of owner housing units that are single-family: 96.0%
- Percentage of renter housing units that are single-family: 41.2%
- Total single-family housing units: 239,276
- Total housing units: 340,639
Photo Credit: Timothy Milan Kuret / Shutterstock
7. Fort Worth, TX
- Percentage of housing units that are single-family: 71.6%
- Percentage of owner housing units that are single-family: 97.1%
- Percentage of renter housing units that are single-family: 36.2%
- Total single-family housing units: 221,442
- Total housing units: 309,097

Photo Credit: Jon Bilous / Shutterstock
6. Virginia Beach, VA
- Percentage of housing units that are single-family: 72.7%
- Percentage of owner housing units that are single-family: 93.2%
- Percentage of renter housing units that are single-family: 38.7%
- Total single-family housing units: 127,265
- Total housing units: 175,029

Photo Credit: Sean Pavone / Shutterstock
5. El Paso, TX
- Percentage of housing units that are single-family: 72.8%
- Percentage of owner housing units that are single-family: 96.2%
- Percentage of renter housing units that are single-family: 41.3%
- Total single-family housing units: 162,508
- Total housing units: 223,076

Photo Credit: Sean Pavone / Shutterstock
4. Oklahoma City, OK
- Percentage of housing units that are single-family: 73.6%
- Percentage of owner housing units that are single-family: 94.6%
- Percentage of renter housing units that are single-family: 45.1%
- Total single-family housing units: 183,630
- Total housing units: 249,615

Photo Credit: f11photo / Shutterstock
3. Detroit, MI
- Percentage of housing units that are single-family: 74.0%
- Percentage of owner housing units that are single-family: 92.9%
- Percentage of renter housing units that are single-family: 56.7%
- Total single-family housing units: 197,656
- Total housing units: 267,139

Photo Credit: Sean Pavone / Shutterstock
2. Wichita, KS
- Percentage of housing units that are single-family: 75.7%
- Percentage of owner housing units that are single-family: 96.1%
- Percentage of renter housing units that are single-family: 46.1%
- Total single-family housing units: 116,227
- Total housing units: 153,454
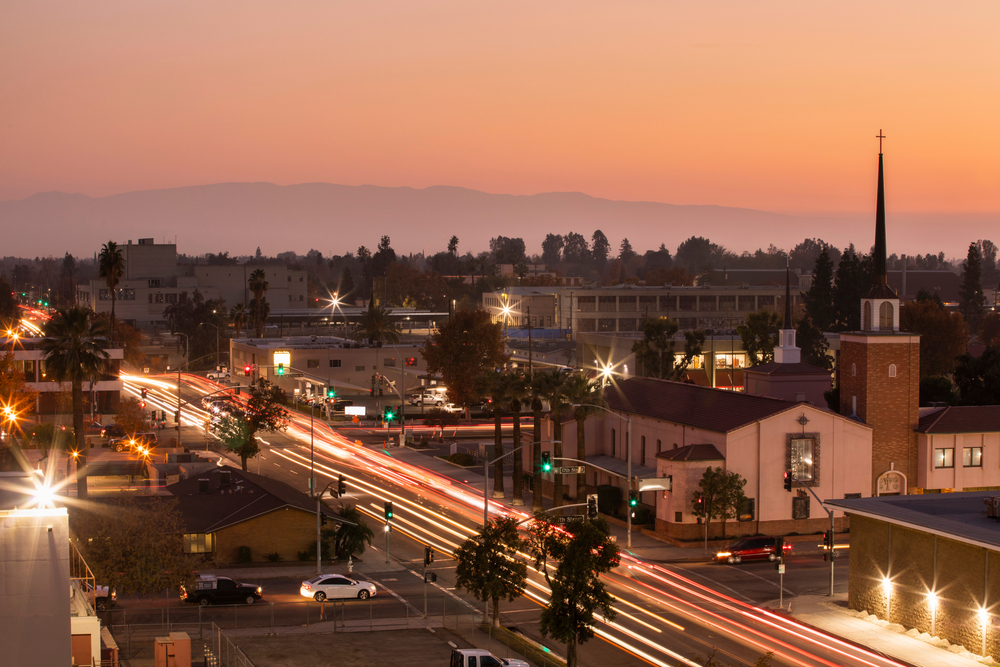
Photo Credit: Matt Gush / Shutterstock
1. Bakersfield, CA
- Percentage of housing units that are single-family: 76.2%
- Percentage of owner housing units that are single-family: 95.2%
- Percentage of renter housing units that are single-family: 48.4%
- Total single-family housing units: 88,830
- Total housing units: 116,558
Detailed Findings & Methodology
The data used in this analysis is from the U.S. Census Bureau’s 2019 American Community Survey. To determine the locations with the most single-family homes, researchers calculated the percentage of housing units that are single-family, defined as “single unit, detached” or “single unit, attached”. In the event of a tie, the location with the higher percentage of owner housing units that are single-family was ranked higher. To improve relevance, only cities with at least 100,000 residents were included. Additionally, cities were grouped into cohorts based on population size: small (100,000–149,999), midsize (150,000–349,999), and large (350,000 or more).