
Photo Credit: fizkes / Shutterstock
As the U.S. continues to navigate the lasting ripple effects of the COVID-19 pandemic, key economic indicators are sending mixed messages about where the economy stands today.
On the positive side, GDP increased by 6.9% in the last three months of 2021, and consumer spending started off strong in 2022. Simultaneously, year-over-year inflation is at record levels according to the Consumer Price Index, and the U.S. Federal Reserve is raising interest rates to slow the economy. Many supply chain issues from 2021 have extended into 2022, with new COVID outbreaks in China, the war in Ukraine, and high energy prices creating additional challenges.
The labor market provides another set of unclear signals. The Bureau of Labor Statistics reported in April 2022 that the unemployment rate had fallen to 3.6%, around where it was in February 2020 before the pandemic hit the U.S. The “Great Resignation” has record numbers of workers leaving jobs to seek out positions that pay more or provide better working conditions. But workers have more power in the economy in large part because the labor force participation rate remains below pre-pandemic levels, which means fewer people are available for all the jobs that are currently open.
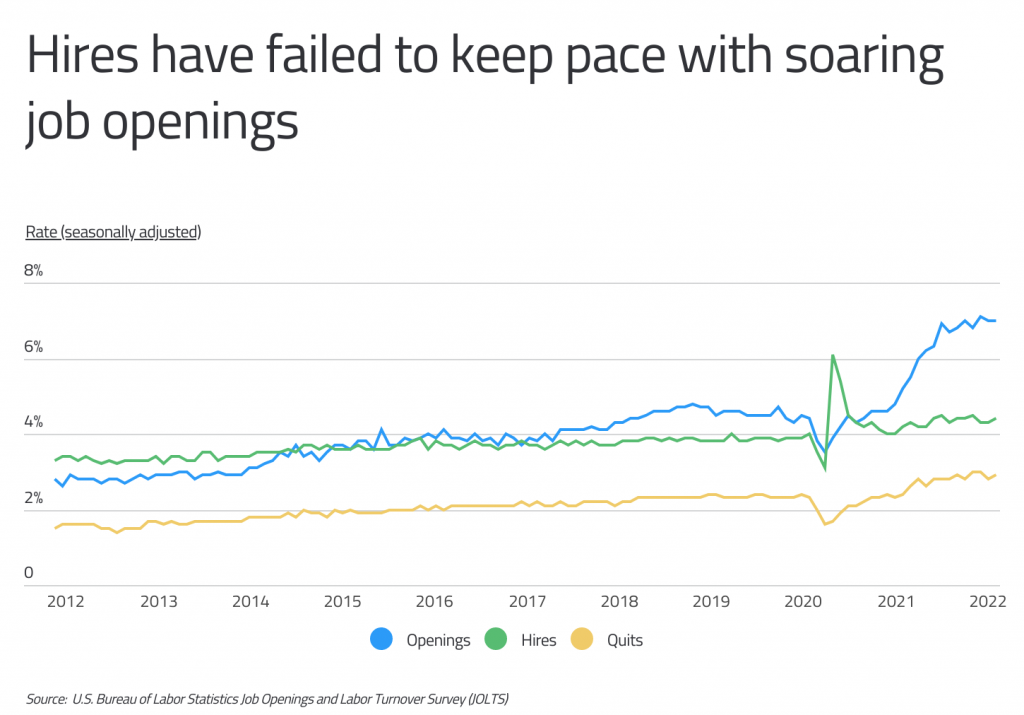
Additional BLS data confirms the gap between open positions and hires. After falling to 3.5% amid COVID shutdowns in April 2020, the rate of job openings has doubled to 7% over the last two years. While the rate of hiring has been above 4%—higher than typical levels historically—every month since May 2020, this figure has not been sufficient to keep up with the explosion of open positions. And employers face even more challenges with the quit rate at around 3%, meaning that they are struggling to retain employees in addition to hiring new ones.
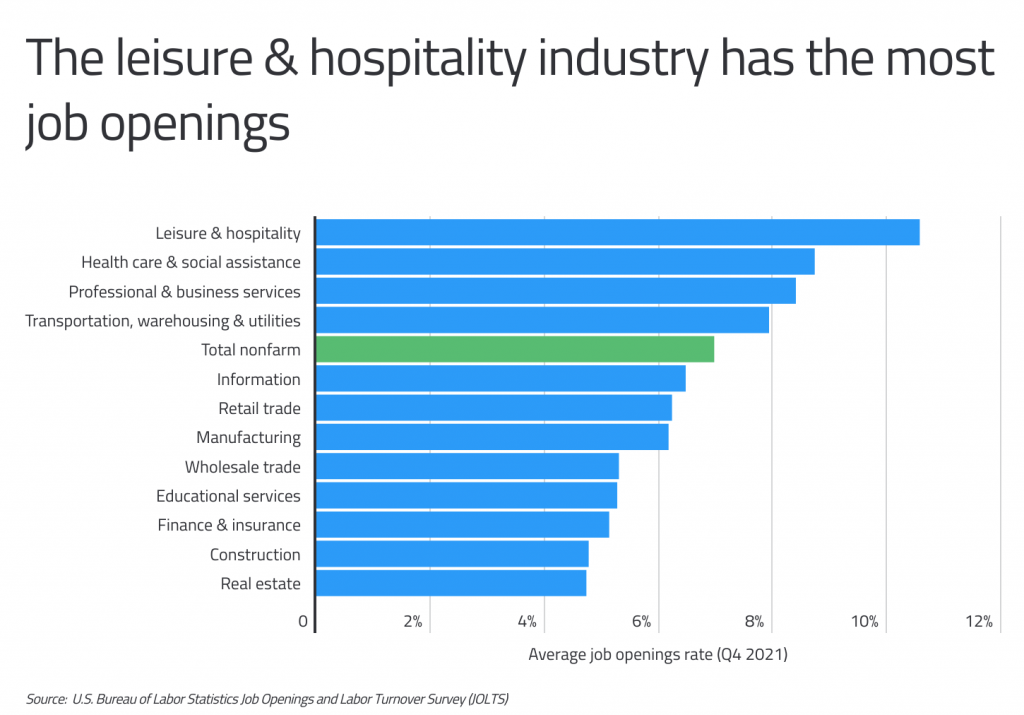
But as with many aspects of the current economy, the overall statistics do not tell the full story, and the hiring outlook depends heavily on industry. Many of the sectors with the highest job openings rates have been the most challenging to work in during the pandemic. Leisure and hospitality businesses, whose workers face low wages and greater volatility in their working conditions due to the effects of COVID, have a job openings rate of 10.57%. The health care and social assistance industry, whose workers have been on the front lines of the pandemic, has a job openings rate of 8.73%. In comparison, the total nonfarm rate is 6.97%, and in fields like construction and real estate, the rate is below 5.00%.
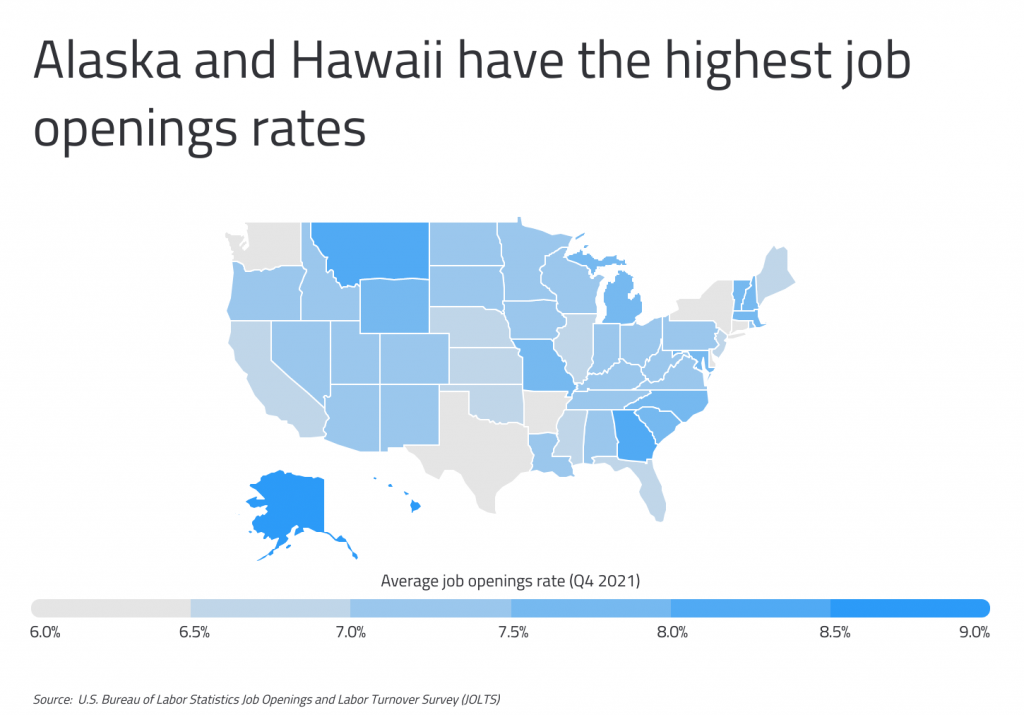
The rate of openings is also dependent on geography. At the high end, Alaska (9.00%) and Hawaii (8.60%) have the highest job openings rates, which may in part be due to the difficulty of recruiting labor to their more remote locations. In contrast, states with rapid economic growth like Washington (6.13%) and Texas (6.47%) or with denser populations like New York (6.17%) and Connecticut (6.20%) have lower rates of openings.
The data used in this analysis is from the U.S. Bureau of Labor Statistics Job Openings and Labor Turnover Survey (JOLTS). To determine the states with the most job openings, researchers at Commodity.com calculated the average job openings rate for the fourth quarter of 2021, the most recent quarter available. In the event of a tie, the state with the greater total number of job openings was ranked higher. Researchers also included statistics on hiring rates, total hires, and total employment.
Here are the states with the most job openings.
U.S. States With the Most Job Openings
Photo Credit: Sean Pavone / Shutterstock
15. West Virginia
- Average job openings rate: 7.47%
- Average hire rate: 5.13%
- Average monthly job openings: 56,000
- Average monthly hires: 35,667
- Average monthly employment: 694,805
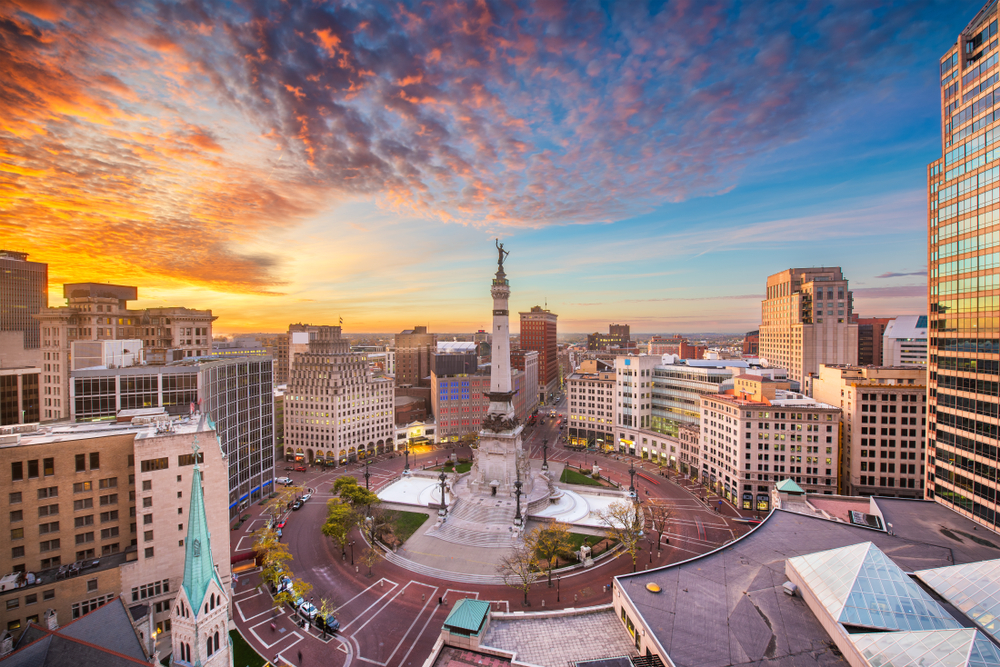
Photo Credit: Sean Pavone / Shutterstock
14. Indiana
- Average job openings rate: 7.47%
- Average hire rate: 4.77%
- Average monthly job openings: 251,333
- Average monthly hires: 148,000
- Average monthly employment: 3,104,895
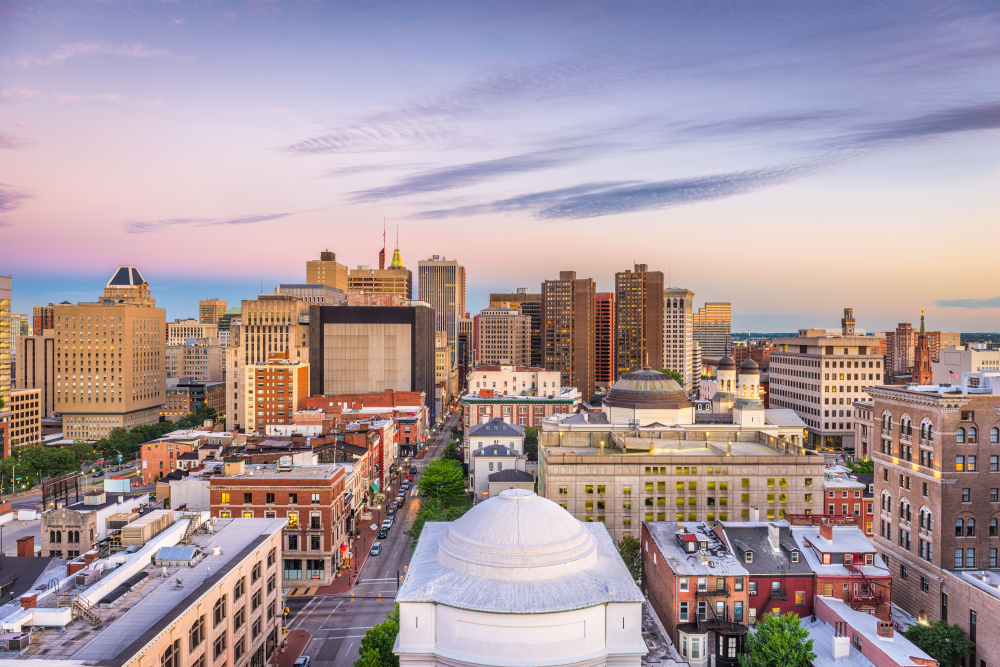
Photo Credit: Sean Pavone / Shutterstock
13. Maryland
- Average job openings rate: 7.50%
- Average hire rate: 3.80%
- Average monthly job openings: 217,667
- Average monthly hires: 102,333
- Average monthly employment: 2,692,982
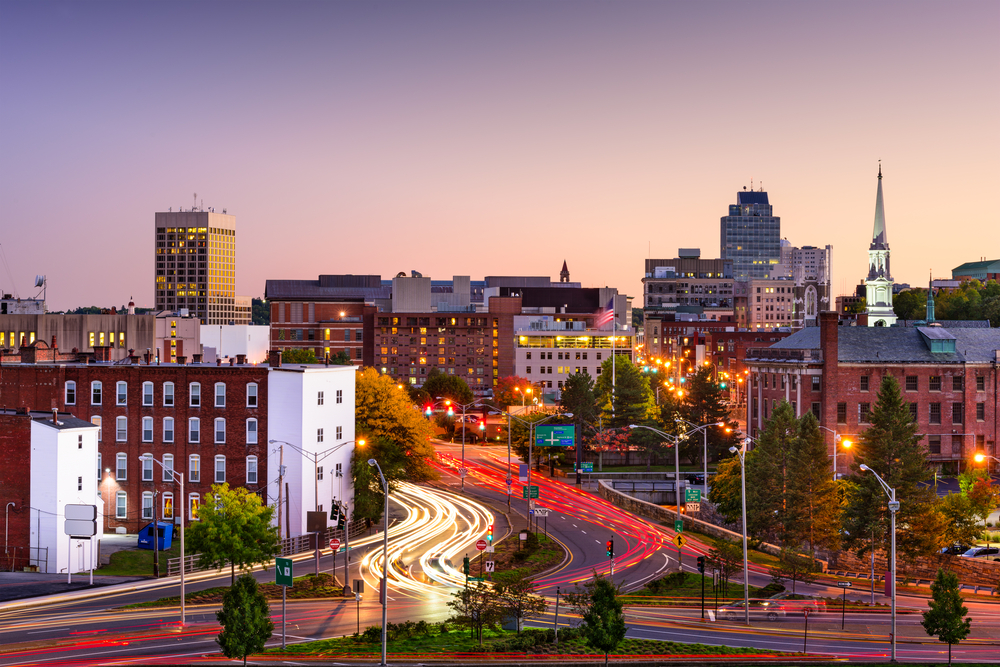
Photo Credit: Sean Pavone / Shutterstock
12. Massachusetts
- Average job openings rate: 7.50%
- Average hire rate: 3.70%
- Average monthly job openings: 288,667
- Average monthly hires: 132,333
- Average monthly employment: 3,576,577
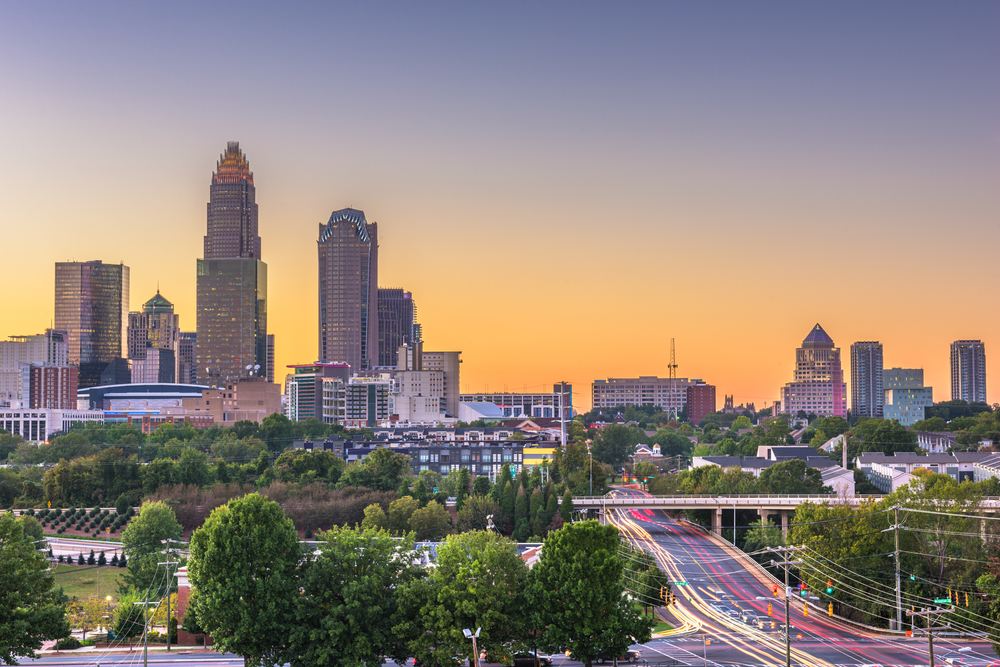
Photo Credit: Sean Pavone / Shutterstock
11. North Carolina
- Average job openings rate: 7.57%
- Average hire rate: 5.07%
- Average monthly job openings: 375,667
- Average monthly hires: 232,333
- Average monthly employment: 4,585,526
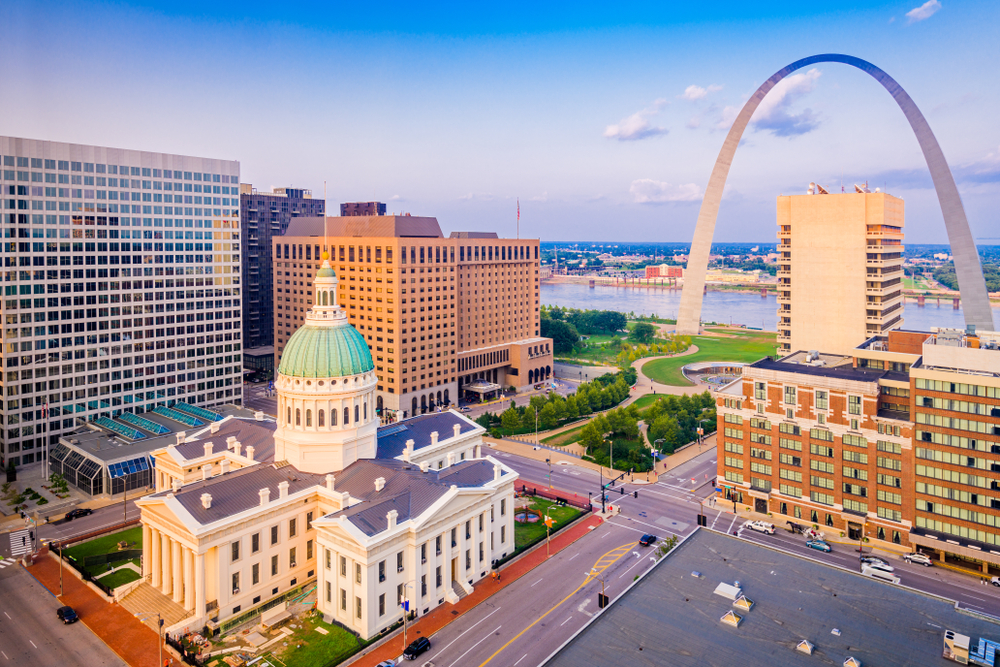
Photo Credit: Sean Pavone / Shutterstock
10. Missouri
- Average job openings rate: 7.60%
- Average hire rate: 4.03%
- Average monthly job openings: 235,333
- Average monthly hires: 115,000
- Average monthly employment: 2,851,240
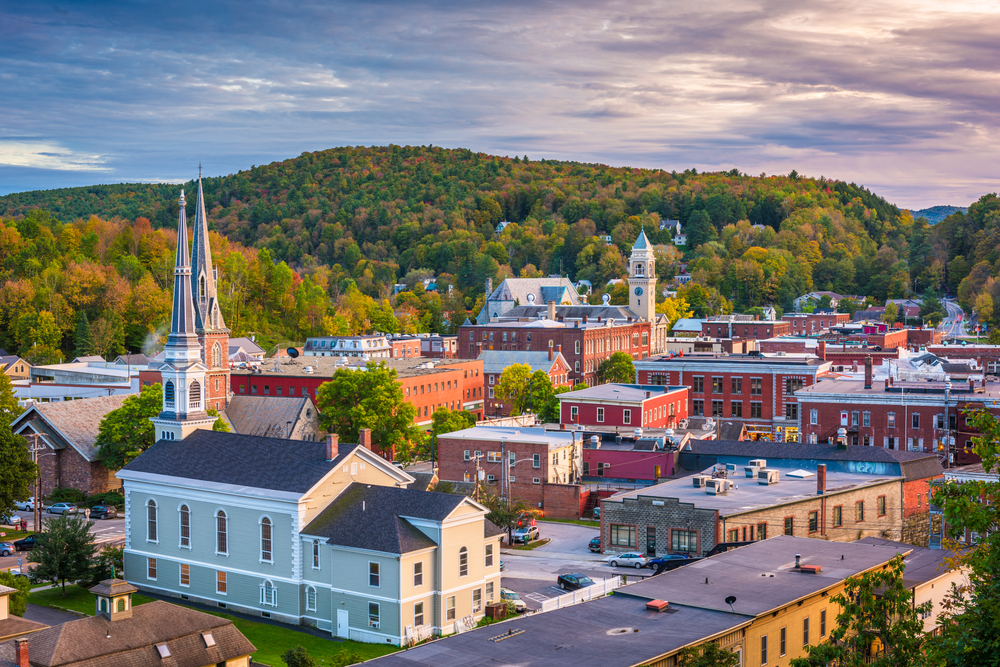
Photo Credit: Sean Pavone / Shutterstock
9. Vermont
- Average job openings rate: 7.77%
- Average hire rate: 4.70%
- Average monthly job openings: 25,000
- Average monthly hires: 14,000
- Average monthly employment: 297,872
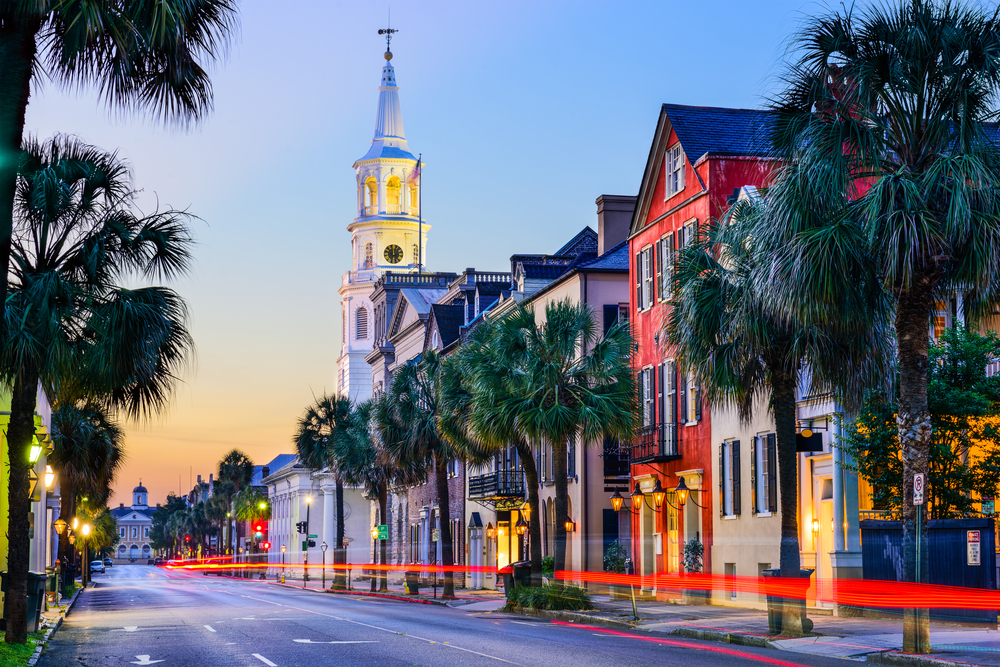
Photo Credit: Sean Pavone / Shutterstock
8. South Carolina
- Average job openings rate: 7.87%
- Average hire rate: 5.57%
- Average monthly job openings: 184,667
- Average monthly hires: 120,333
- Average monthly employment: 2,161,677
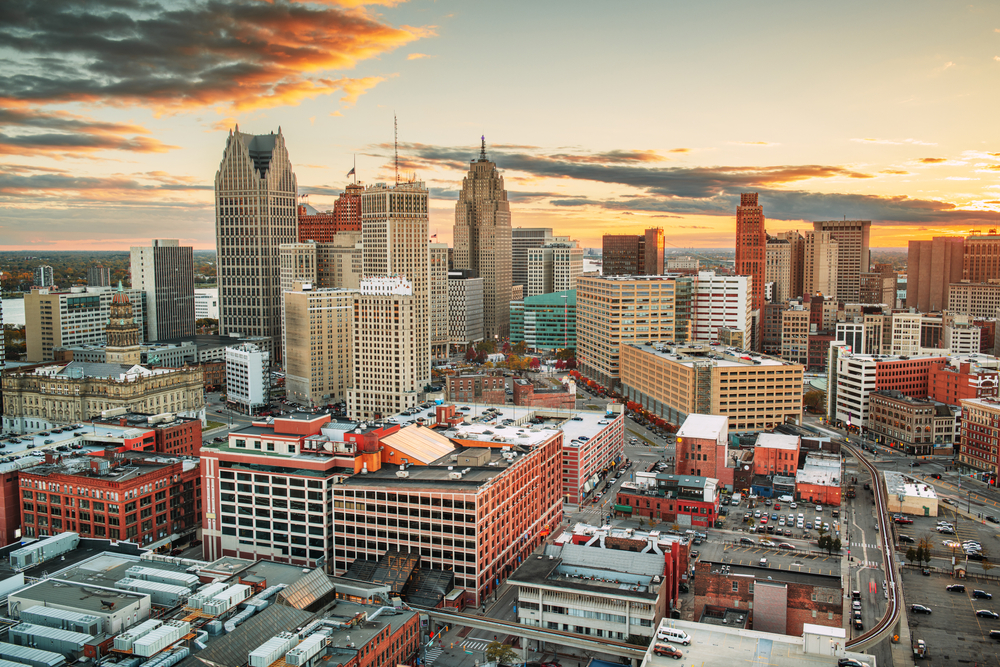
Photo Credit: Sean Pavone / Shutterstock
7. Michigan
- Average job openings rate: 7.90%
- Average hire rate: 4.80%
- Average monthly job openings: 365,333
- Average monthly hires: 204,000
- Average monthly employment: 4,250,000

Photo Credit: Jacob Boomsma / Shutterstock
6. Wyoming
- Average job openings rate: 7.93%
- Average hire rate: 5.17%
- Average monthly job openings: 24,000
- Average monthly hires: 14,333
- Average monthly employment: 277,419

Photo Credit: Sean Pavone / Shutterstock
5. New Hampshire
- Average job openings rate: 7.93%
- Average hire rate: 4.80%
- Average monthly job openings: 57,667
- Average monthly hires: 32,000
- Average monthly employment: 666,667

Photo Credit: Sean Pavone / Shutterstock
4. Georgia
- Average job openings rate: 8.23%
- Average hire rate: 5.30%
- Average monthly job openings: 416,667
- Average monthly hires: 245,333
- Average monthly employment: 4,628,931
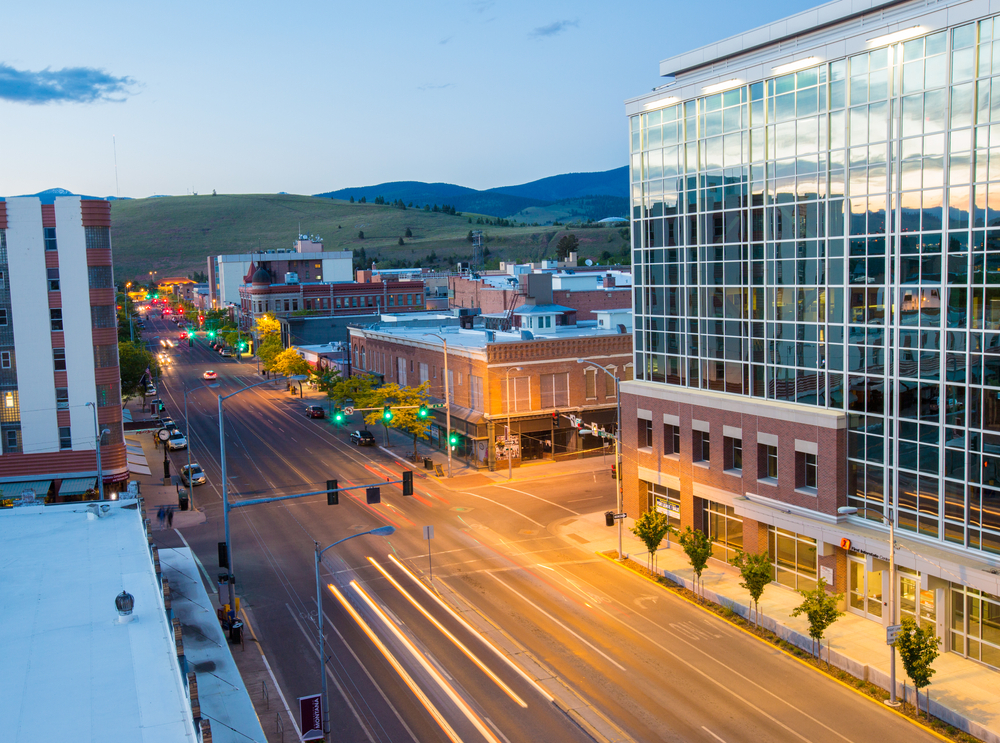
Photo Credit: Mary Vanier / Shutterstock
3. Montana
- Average job openings rate: 8.37%
- Average hire rate: 5.40%
- Average monthly job openings: 44,667
- Average monthly hires: 26,333
- Average monthly employment: 487,654

Photo Credit: Dave H. Fine / Shutterstock
2. Hawaii
- Average job openings rate: 8.60%
- Average hire rate: 5.73%
- Average monthly job openings: 55,000
- Average monthly hires: 33,333
- Average monthly employment: 581,395
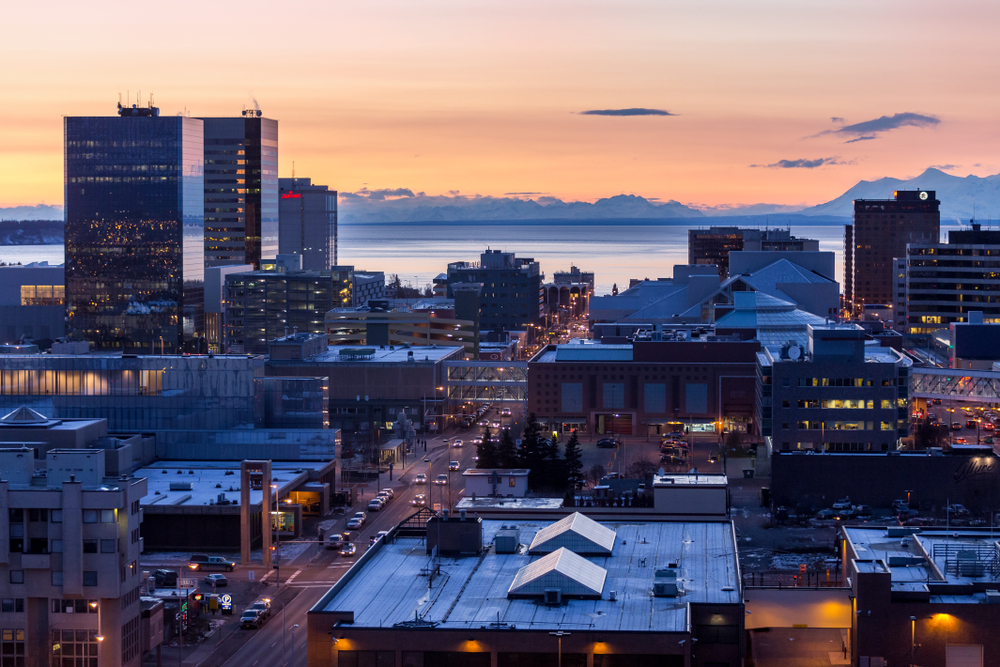
Photo Credit: Marcus Biastock / Shutterstock
1. Alaska
- Average job openings rate: 9.00%
- Average hire rate: 6.17%
- Average monthly job openings: 31,000
- Average monthly hires: 19,333
- Average monthly employment: 313,514
Methodology & Detailed Findings
The data used in this analysis is from the U.S. Bureau of Labor Statistics Job Openings and Labor Turnover Survey (JOLTS). To determine the states with the most job openings, researchers calculated the average job openings rate for the fourth quarter of 2021, the most recent quarter available. In the event of a tie, the state with the greater total number of job openings was ranked higher. Researchers also included statistics on hiring rates, total hires, and total employment.


