
Photo Credit: New Africa / Shutterstock
According to the U.S. Department of Veterans Affairs, there are about 19 million veterans living in America. Many of these people who served their country are starting businesses, joining an increasing number of Americans who sought to become entrepreneurs after the onset of COVID-19, according to the U.S. Census Bureau.
Demographic data sheds light on who these veterans are. According to the U.S. Bureau of Labor Statistics, around nine out of 10 veterans are men. The largest cohort is over 60 years old, comprising about a 35% share of the U.S. veteran population. In October 2021, an estimated 8.4 million veterans participated in the civilian workforce, and in 2021, the unemployment rate for veterans (4.4%) was lower than the rate for nonveterans (5.3%).
The rise in overall entrepreneurship seems logical in the face of an undeniable fact: a decreasing number of Americans are realizing the American Dream. According to Pew Research, the U.S. middle class has contracted steadily over the last five decades. In 1971, the share of American adults who lived in middle-class households was 61%. By 2021, that number was 50%. Pandemic-related financial issues impacted lower- and middle-income households the hardest; from 2019 to 2020, median incomes fell 3.0% for lower-income households and 2.1% for middle-income households. There was almost no change in the median incomes of upper-income households during the same period.
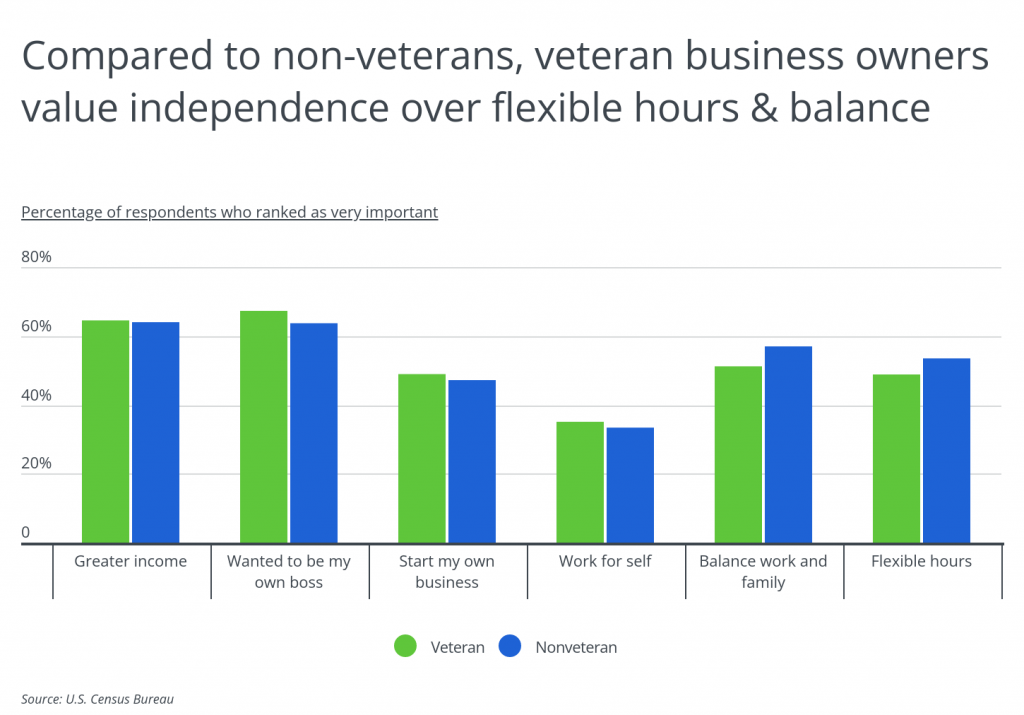
For most business owners (roughly 64% according to the Census Bureau’s Annual Business Survey), achieving greater income is one of the primary drivers behind owning their businesses. And that number is fairly consistent across veterans and nonveterans. Interestingly though, when comparing veteran business owners to nonveteran owners across other metrics, there are a few notable differences. Compared to nonveterans, veteran business owners value being their own boss, working for themselves, and wanting to start their own business more heavily. On the other hand, nonveterans are more likely to report having flexible hours and a better work-life balance as primary motivators for business ownership.
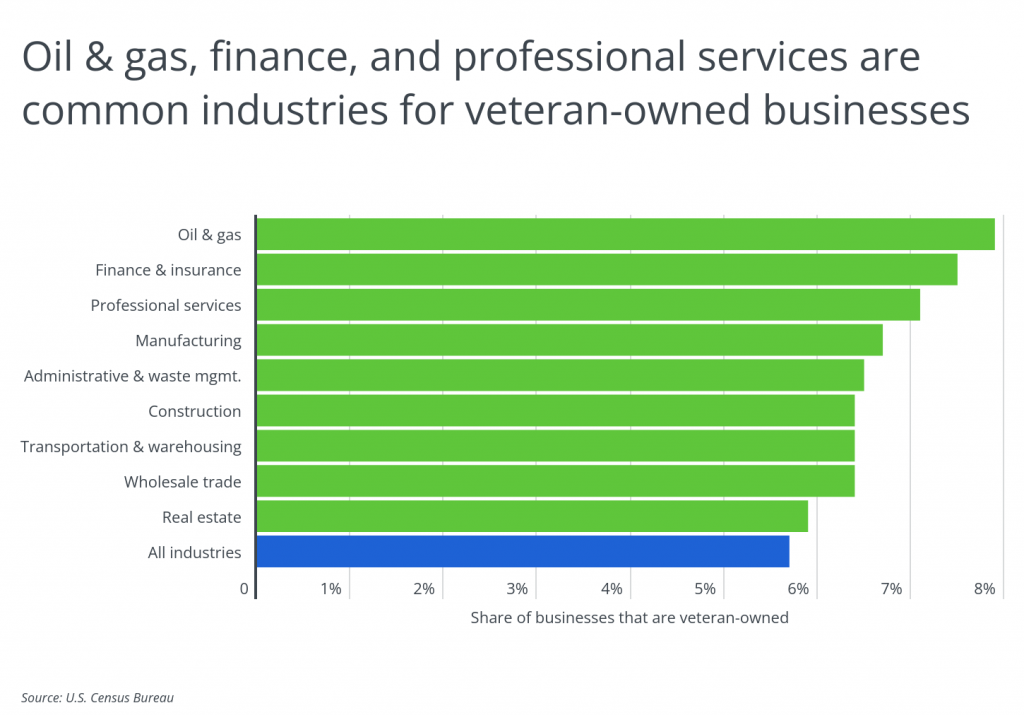
While nearly 6% of employer firms overall are owned by veterans, the concentration of veteran-owned businesses varies by industry. Comparing what types of businesses veterans started to overall filings for new businesses shows some divergence. The top industries for entrepreneurs who are veterans include oil & gas, finance, professional services, manufacturing, construction, and transportation. According to the Business Formation Statistics from the U.S. Census Bureau, the top types of overall new businesses from 2020 to 2021 were in retail trade (including e-commerce), professional services, construction, and transportation and warehousing. Veterans are least likely to own businesses in the arts, entertainment, education, accommodation, and food services sectors.
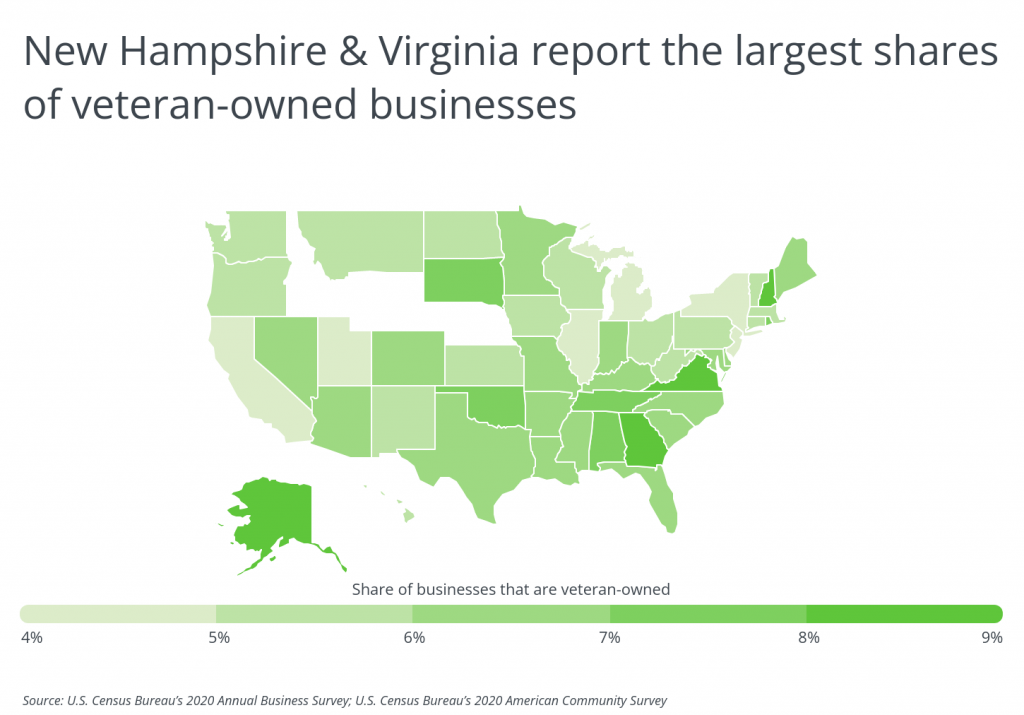
States where the highest number of veterans call home are California, Texas, and Florida, and these three states also have the country’s highest total numbers of veteran-owned businesses. Looking at the proportion of businesses that are veteran-owned by state shows a cohort of Eastern and Southern states, ranging from New Hampshire, Virginia, and Georgia to Tennessee, Oklahoma, and Alabama. At the metro level, the concentration of veteran-owned firms mirrors the state-level trends with higher percentages in metropolitan areas located in Eastern and Southern states. These include cities in Maryland, North Carolina, Virginia, Florida, and Georgia.
The data used in this analysis is from the U.S. Census Bureau’s 2020 Annual Business Survey and the U.S. Census Bureau’s 2020 American Community Survey. To determine the locations with the most veteran-owned businesses, researchers at HireAHelper calculated the share of employer firms (those businesses with paid employees) that are veteran-owned. Researchers also included statistics on the total number of veteran-owned firms, employees and revenue at these firms, and the veteran population share in each location.
Here are the major U.S. metropolitan areas with the most veteran-owned businesses.
Large Metros With the Most Veteran-Owned Businesses

Photo Credit: Sean Pavone / Shutterstock
15. St. Louis, MO-IL
- Share of businesses that are veteran-owned: 6.5%
- Total businesses that are veteran-owned: 3,366
- Employees at veteran-owned businesses: 43,677
- Annual revenue at veteran-owned businesses: $5 billion or more
- Veteran population share: 8.2%

Photo Credit: Sean Pavone / Shutterstock
14. Birmingham-Hoover, AL
- Share of businesses that are veteran-owned: 6.7%
- Total businesses that are veteran-owned: 1,325
- Employees at veteran-owned businesses: 10,390
- Annual revenue at veteran-owned businesses: $1 billion to less than $5 billion
- Veteran population share: 7.4%

Photo Credit: Agnieszka Gaul / Shutterstock
13. Cincinnati, OH-KY-IN
- Share of businesses that are veteran-owned: 6.7%
- Total businesses that are veteran-owned: 2,155
- Employees at veteran-owned businesses: 28,780
- Annual revenue at veteran-owned businesses: $5 billion or more
- Veteran population share: 7.1%

Photo Credit: Sean Pavone / Shutterstock
12. Tucson, AZ
- Share of businesses that are veteran-owned: 6.8%
- Total businesses that are veteran-owned: 1,069
- Employees at veteran-owned businesses: 12,395
- Annual revenue at veteran-owned businesses: $1 billion to less than $5 billion
- Veteran population share: 10.5%

Photo Credit: Sean Pavone / Shutterstock
11. Tulsa, OK
- Share of businesses that are veteran-owned: 6.8%
- Total businesses that are veteran-owned: 1,293
- Employees at veteran-owned businesses: 12,842
- Annual revenue at veteran-owned businesses: $1 billion to less than $5 billion
- Veteran population share: 8.2%

Photo Credit: Richard Cavalleri / Shutterstock
10. Providence-Warwick, RI-MA
- Share of businesses that are veteran-owned: 6.8%
- Total businesses that are veteran-owned: 2,264
- Employees at veteran-owned businesses: 30,279
- Annual revenue at veteran-owned businesses: $5 billion or more
- Veteran population share: 6.2%

Photo Credit: Jon Bilous / Shutterstock
9. Charlotte-Concord-Gastonia, NC-SC
- Share of businesses that are veteran-owned: 6.8%
- Total businesses that are veteran-owned: 3,212
- Employees at veteran-owned businesses: 47,519
- Annual revenue at veteran-owned businesses: $5 billion or more
- Veteran population share: 7.0%

Photo Credit: Sean Pavone / Shutterstock
8. Richmond, VA
- Share of businesses that are veteran-owned: 6.9%
- Total businesses that are veteran-owned: 1,771
- Employees at veteran-owned businesses: 15,375
- Annual revenue at veteran-owned businesses: $1 billion to less than $5 billion
- Veteran population share: 8.7%

Photo Credit: Virrage Images / Shutterstock
7. Las Vegas-Henderson-Paradise, NV
- Share of businesses that are veteran-owned: 6.9%
- Total businesses that are veteran-owned: 2,578
- Employees at veteran-owned businesses: 37,474
- Annual revenue at veteran-owned businesses: $5 billion or more
- Veteran population share: 8.2%

Photo Credit: Agnieszka Gaul / Shutterstock
6. Indianapolis-Carmel-Anderson, IN
- Share of businesses that are veteran-owned: 7.1%
- Total businesses that are veteran-owned: 2,369
- Employees at veteran-owned businesses: 36,856
- Annual revenue at veteran-owned businesses: $5 billion or more
- Veteran population share: 7.0%

Photo Credit: f11photo / Shutterstock
5. Baltimore-Columbia-Towson, MD
- Share of businesses that are veteran-owned: 7.3%
- Total businesses that are veteran-owned: 3,766
- Employees at veteran-owned businesses: 53,920
- Annual revenue at veteran-owned businesses: $5 billion or more
- Veteran population share: 7.8%

Photo Credit: Sean Pavone / Shutterstock
4. Washington-Arlington-Alexandria, DC-VA-MD-WV
- Share of businesses that are veteran-owned: 7.5%
- Total businesses that are veteran-owned: 8,351
- Employees at veteran-owned businesses: 125,645
- Annual revenue at veteran-owned businesses: $5 billion or more
- Veteran population share: 8.0%

Photo Credit: Natalia Bratslavsky / Shutterstock
3. Oklahoma City, OK
- Share of businesses that are veteran-owned: 8.5%
- Total businesses that are veteran-owned: 2,476
- Employees at veteran-owned businesses: 20,790
- Annual revenue at veteran-owned businesses: $1 billion to less than $5 billion
- Veteran population share: 9.1%

Photo Credit: GagliardiPhotography / Shutterstock
2. Jacksonville, FL
- Share of businesses that are veteran-owned: 8.9%
- Total businesses that are veteran-owned: 2,626
- Employees at veteran-owned businesses: 34,630
- Annual revenue at veteran-owned businesses: $5 billion or more
- Veteran population share: 12.1%

Photo Credit: Alexandr Junek Imaging / Shutterstock
1. Virginia Beach-Norfolk-Newport News, VA-NC
- Share of businesses that are veteran-owned: 10.9%
- Total businesses that are veteran-owned: 2,905
- Employees at veteran-owned businesses: 43,697
- Annual revenue at veteran-owned businesses: $5 billion or more
- Veteran population share: 16.0%
Detailed Findings & Methodology
The data used in this analysis is from the U.S. Census Bureau’s 2020 Annual Business Survey and the U.S. Census Bureau’s 2020 American Community Survey. To determine the locations with the most veteran-owned businesses, researchers calculated the share of employer firms (those businesses with paid employees) that are veteran-owned. In the event of a tie, the location with the greater total number of employer firms that are veteran-owned was ranked higher. To improve relevance, only metropolitan areas with at least 100,000 residents and available data from Census were included. Additionally, metros were grouped into cohorts based on population size: small (100,000–349,999), midsize (350,000–999,999), and large (1,000,000 or more).


