Photo Credit: jessica.kirsh / Shutterstock
After a two-year frenzy during the COVID-19 pandemic, the residential real estate market has begun to show signs of slowing down this spring and summer. Mortgage rates are on the rise, and applications for home loans are down year-over-year. Housing inventory for sale is increasing, and sellers are showing more willingness to lower their asking prices.
While there are recent signs that the market is balancing out, the last two years brought unprecedented growth in home values, to the benefit of current owners and homebuilders. With low interest rates, homebuyers were able to borrow more money and pay more for homes. This sent prices to record levels. And with values rising quickly, builders have rushed to build housing: the number of units currently under construction is at its highest level since the 1970s.
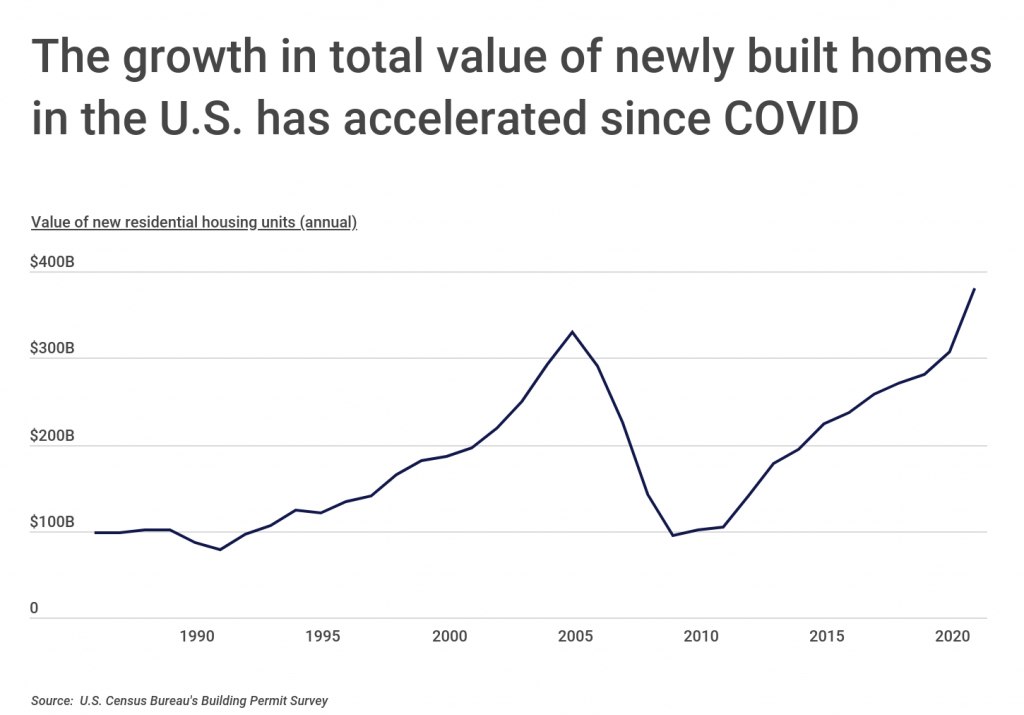
The value of new residential units had already been on a steady upward trajectory since the collapse of the housing bubble and ensuing Great Recession in the mid-2000s. After bottoming out at around $95 billion in 2009, the annual value of new housing units nearly tripled over the next decade to $280 billion in 2019. But this growth accelerated even further during the COVID-19 pandemic, with new units valued at $307 billion in 2020 and leaping to $380 billion last year.
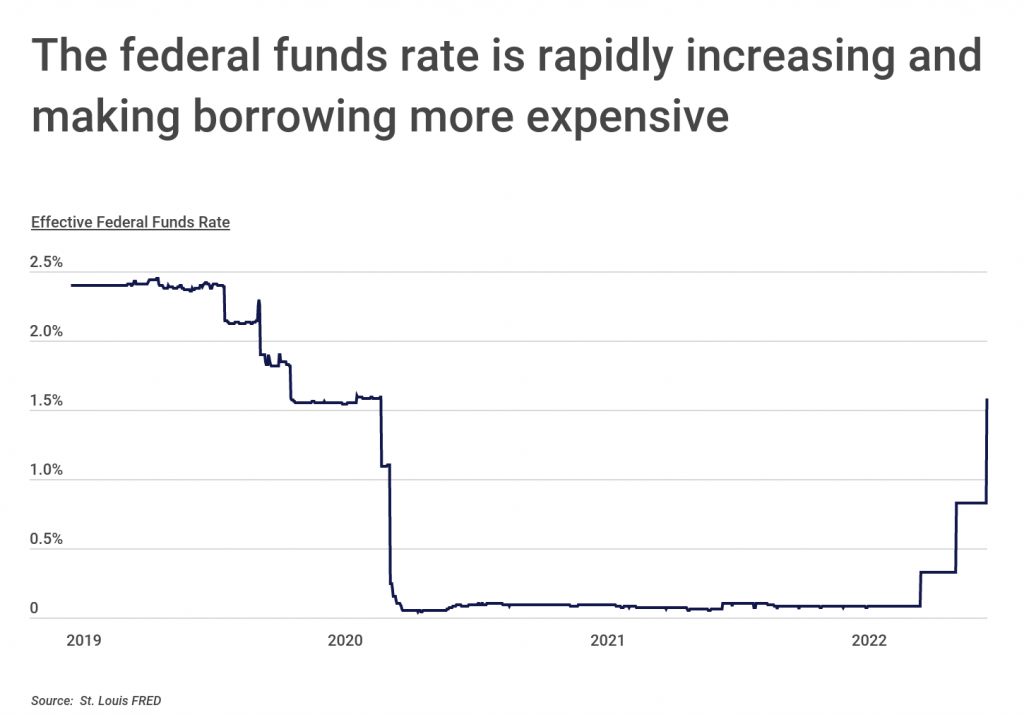
The spike in new home values came amid a period of historically low interest rates as the U.S. Federal Reserve attempted to stimulate the economy during the COVID-19 pandemic. As the central bank of the U.S., the Fed’s monetary policy moves affect how much it costs other banks—and in turn their customers—to borrow. The Fed sent its effective federal funds rate to near zero early in 2020 and kept rates low for the next two years. But now, with persistent inflation widely affecting every corner of the economy, the Fed has begun to raise interest rates to tamp down borrowing and cool the economy, and more increases are on the horizon this year. As costs to borrow increase, fewer homebuyers will seek mortgages, and financing for new construction projects will become more expensive.
While interest rate hikes are likely to cool demand and slow the pace of home price increases, the Fed’s recent moves cannot solve the housing market’s more fundamental supply challenges. According to researchers at Freddie Mac, the U.S. had a 3.8 million-unit deficit of housing supply in 2020. And with labor shortages and increased material costs during the pandemic, new construction projects may take longer or cost more to complete.
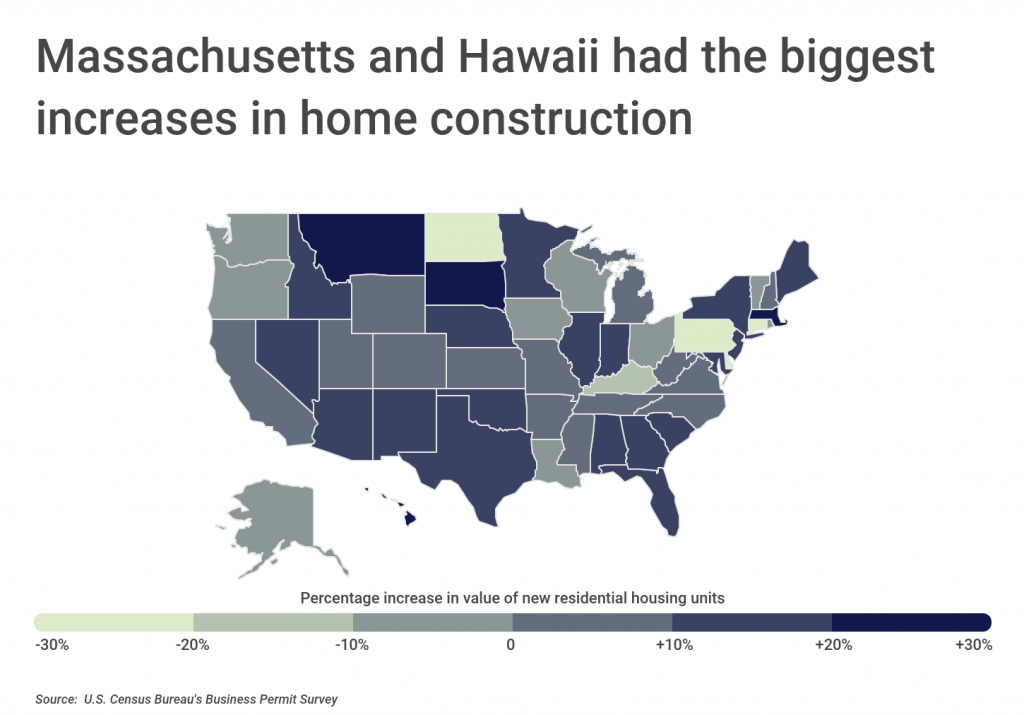
Some locations, however, are investing more in new residential construction than others compared to the same time last year. Massachusetts—one of the most expensive states for housing due to low supply—saw the value of new residential housing permits increase by more than a third from the first months of 2021 to the same period in 2022. Another high-cost state, Hawaii, had an increase of 28.2% over the same span. And at the metro level, major cities in many parts of the U.S. are adding thousands of new units worth hundreds of millions of dollars.
To determine the metros with the biggest increases in home construction, researchers at Construction Coverage analyzed the latest data from the U.S. Census Bureau’s Building Permits Survey. The researchers ranked metro areas according to the value of residential housing permits authorized from January through April of 2022 compared to the same period in 2021.
Here are the U.S. metros with the biggest increase in home construction.
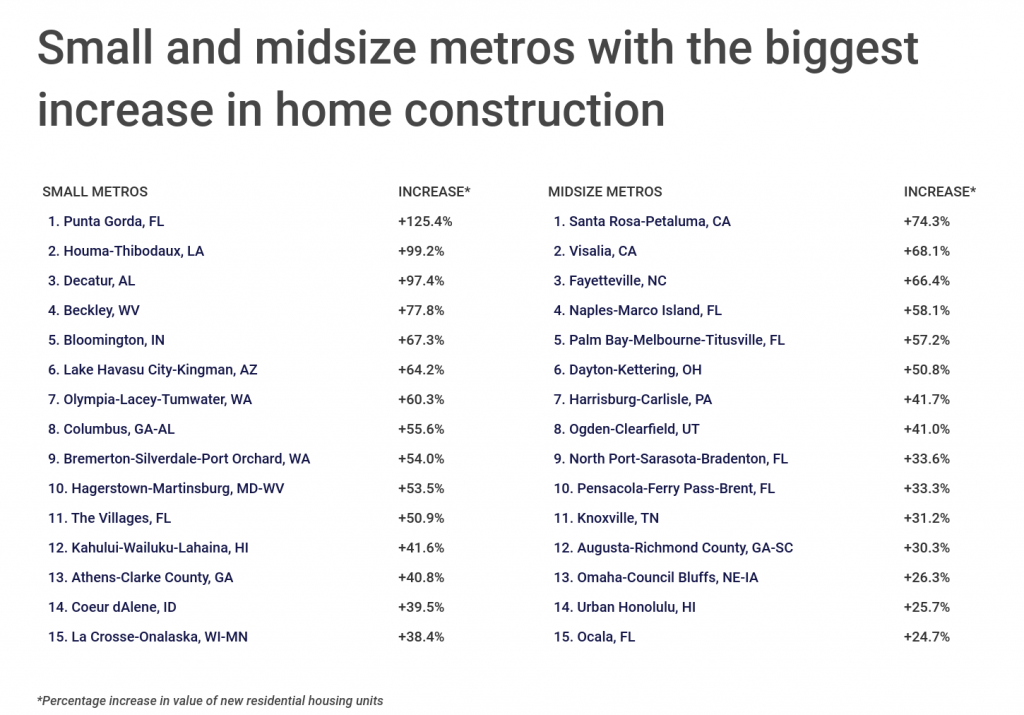
Large Metros With the Biggest Increase in Home Construction

Photo Credit: Sean Pavone / Shutterstock
15. Richmond, VA
- Percentage increase in value of new residential housing units: +15.3%
- Total increase in value of new residential housing units: $82,553,000
- Percentage increase in new residential housing units: +29.2%
- Total increase in new residential housing units: +889
Photo Credit: Sean Pavone / Shutterstock
14. Tucson, AZ
- Percentage increase in value of new residential housing units: +15.9%
- Total increase in value of new residential housing units: $94,136,000
- Percentage increase in new residential housing units: +22.6%
- Total increase in new residential housing units: +477
Photo Credit: Andrew Zarivny / Shutterstock
13. Denver-Aurora-Lakewood, CO
- Percentage increase in value of new residential housing units: +18.2%
- Total increase in value of new residential housing units: $326,017,000
- Percentage increase in new residential housing units: +2.3%
- Total increase in new residential housing units: +208

Photo Credit: Jon Bilous / Shutterstock
12. Charlotte-Concord-Gastonia, NC-SC
- Percentage increase in value of new residential housing units: +20.2%
- Total increase in value of new residential housing units: $428,476,000
- Percentage increase in new residential housing units: +27.5%
- Total increase in new residential housing units: +2,443
Photo Credit: Lucky-photographer / Shutterstock
11. San Diego-Chula Vista-Carlsbad, CA
- Percentage increase in value of new residential housing units: +20.4%
- Total increase in value of new residential housing units: $140,372,000
- Percentage increase in new residential housing units: +2.8%
- Total increase in new residential housing units: +97

Photo Credit: photo.ua / Shutterstock
10. Minneapolis-St. Paul-Bloomington, MN-WI
- Percentage increase in value of new residential housing units: +22.1%
- Total increase in value of new residential housing units: $405,987,000
- Percentage increase in new residential housing units: +12.3%
- Total increase in new residential housing units: +988

Photo Credit: Sean Pavone / Shutterstock
9. Houston-The Woodlands-Sugar Land, TX
- Percentage increase in value of new residential housing units: +22.7%
- Total increase in value of new residential housing units: $1,023,183,000
- Percentage increase in new residential housing units: +18.2%
- Total increase in new residential housing units: +4,138
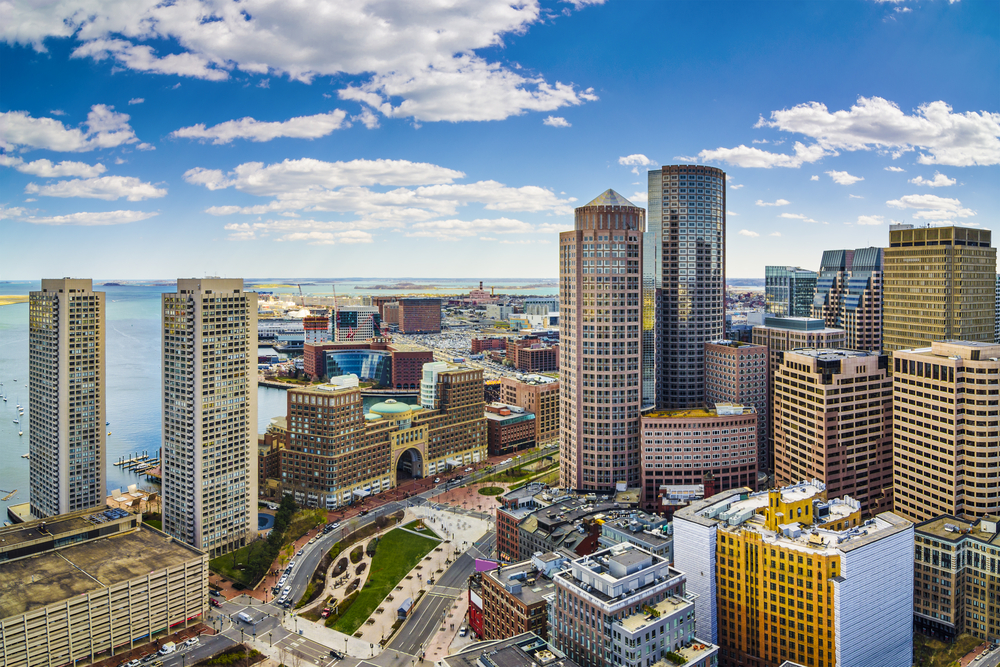
Photo Credit: ESB Professional / Shutterstock
8. Boston-Cambridge-Newton, MA-NH
- Percentage increase in value of new residential housing units: +23.8%
- Total increase in value of new residential housing units: $282,736,000
- Percentage increase in new residential housing units: +6.7%
- Total increase in new residential housing units: +371
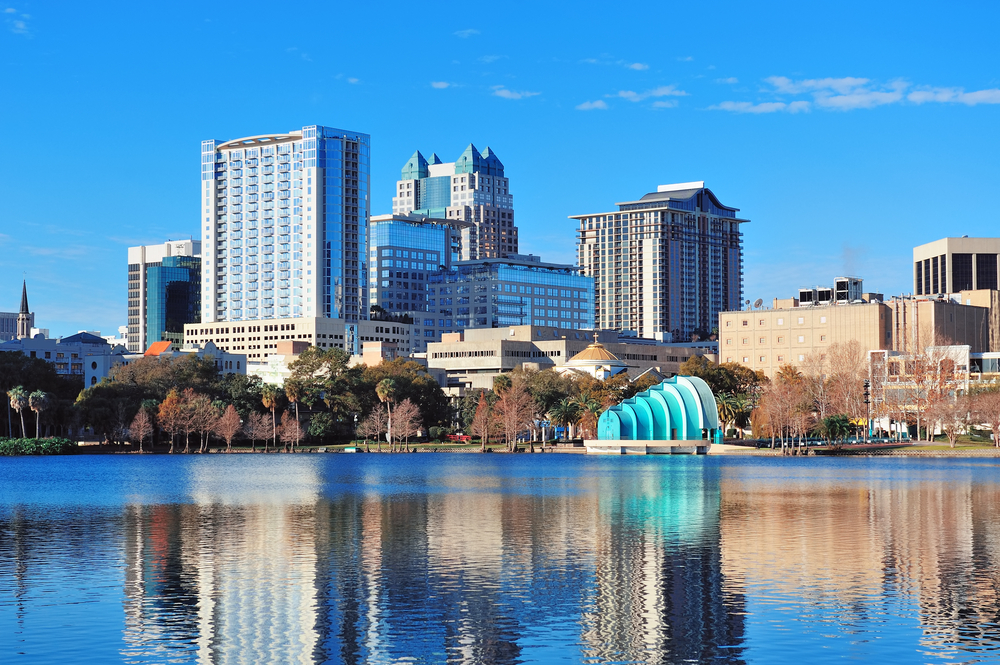
Photo Credit: Songquan Deng / Shutterstock
7. Orlando-Kissimmee-Sanford, FL
- Percentage increase in value of new residential housing units: +26.8%
- Total increase in value of new residential housing units: $513,628,000
- Percentage increase in new residential housing units: +41.8%
- Total increase in new residential housing units: +3,526
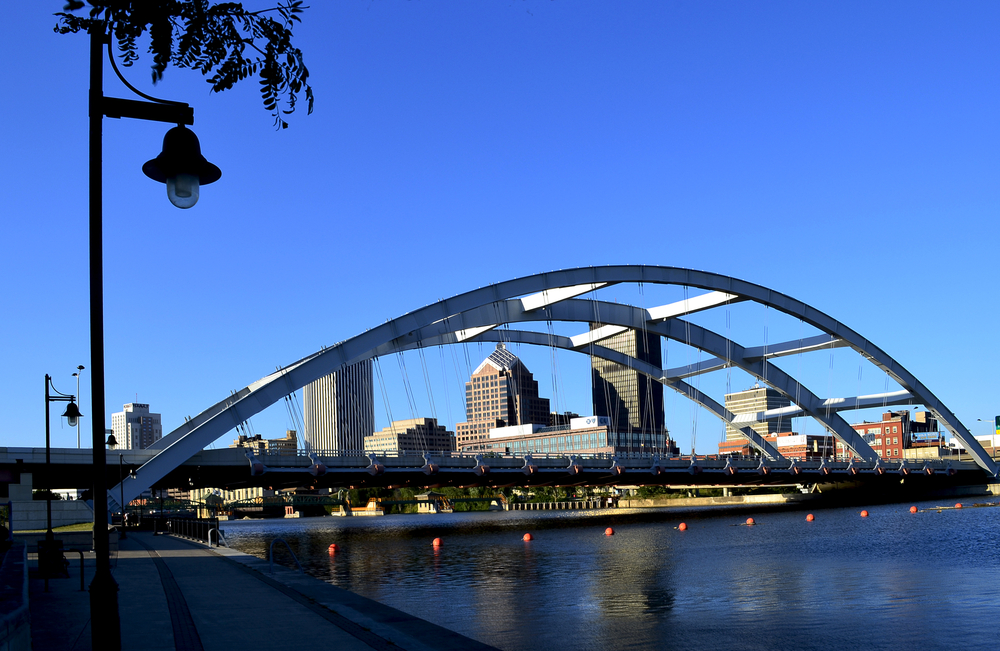
Photo Credit: George Raymond Gibbs / Shutterstock
6. Rochester, NY
- Percentage increase in value of new residential housing units: +31.1%
- Total increase in value of new residential housing units: $42,197,000
- Percentage increase in new residential housing units: +47.0%
- Total increase in new residential housing units: +304

Photo Credit: f11photo / Shutterstock
5. Baltimore-Columbia-Towson, MD
- Percentage increase in value of new residential housing units: +32.6%
- Total increase in value of new residential housing units: $147,101,000
- Percentage increase in new residential housing units: +59.6%
- Total increase in new residential housing units: +1,181
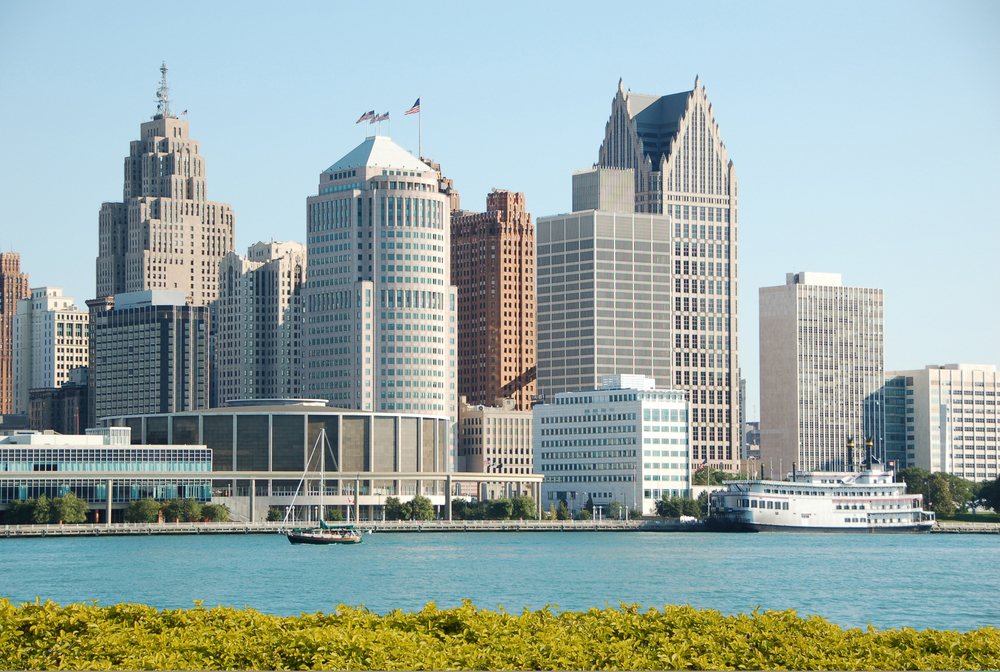
Photo Credit: Ivan Cholakov / Shutterstock
4. Detroit-Warren-Dearborn, MI
- Percentage increase in value of new residential housing units: +33.3%
- Total increase in value of new residential housing units: $244,210,000
- Percentage increase in new residential housing units: +1.4%
- Total increase in new residential housing units: +41

Photo Credit: Ingus Kruklitis / Shutterstock
3. New York-Newark-Jersey City, NY-NJ-PA
- Percentage increase in value of new residential housing units: +33.6%
- Total increase in value of new residential housing units: $845,609,000
- Percentage increase in new residential housing units: +30.3%
- Total increase in new residential housing units: +5,243

Photo Credit: Jon Bilous / Shutterstock
2. Riverside-San Bernardino-Ontario, CA
- Percentage increase in value of new residential housing units: +34.3%
- Total increase in value of new residential housing units: $379,935,000
- Percentage increase in new residential housing units: +23.7%
- Total increase in new residential housing units: +1,104
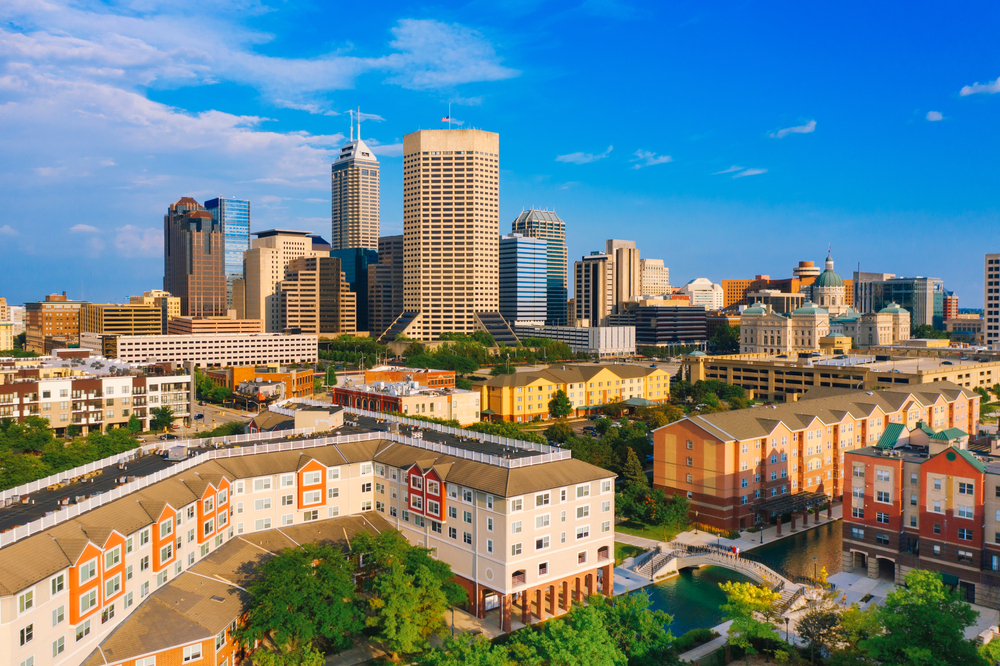
Photo Credit: Agnieszka Gaul / Shutterstock
1. Indianapolis-Carmel-Anderson, IN
- Percentage increase in value of new residential housing units: +34.3%
- Total increase in value of new residential housing units: $371,468,000
- Percentage increase in new residential housing units: +68.4%
- Total increase in new residential housing units: +2,449
Detailed Findings & Methodology
To determine the metros with the biggest increases in home construction, researchers at Construction Coverage analyzed the latest data from the U.S. Census Bureau’s Building Permits Survey. The researchers ranked metro areas according to the value of residential housing permits authorized from January through April of 2022 compared to the same period in 2021. The total increase in value of new residential housing units, the percentage increase in new residential housing units, and the total increase in new residential housing units were also calculated.
Only metropolitan areas with at least 100,000 people and a monthly coverage percentage of at least 90% in January 2021 were included in the analysis. Additionally, metro areas were grouped into the following cohorts based on population size:
- Small metros: 100,000–349,999
- Midsize metros: 350,000–999,999
- Large metros: 1,000,000 or more