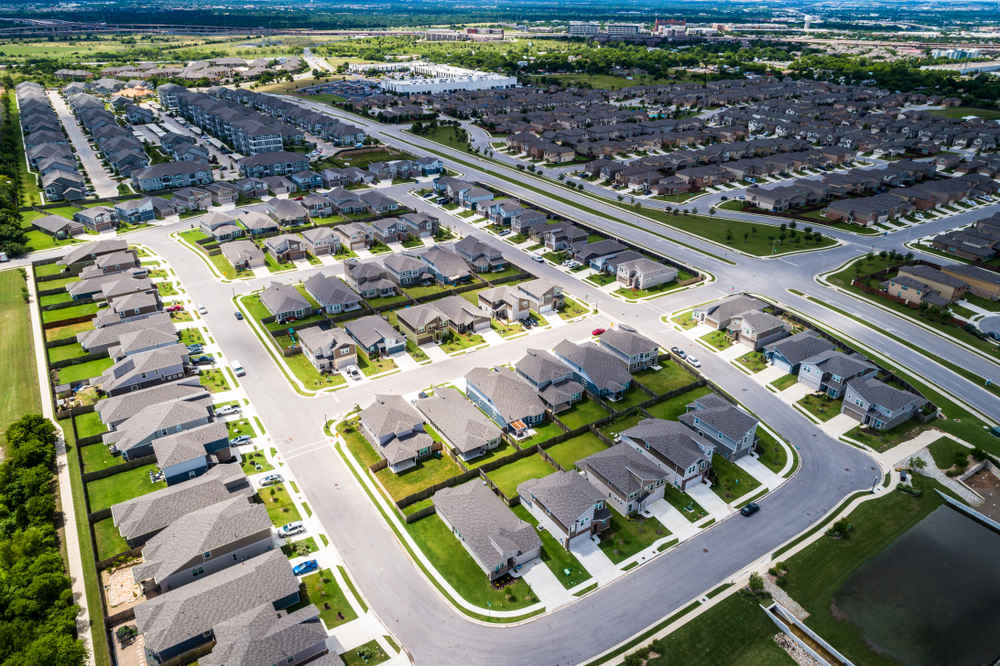
Photo Credit: Roschetzky Photography / Shutterstock
The world population recently passed 8 billion, just 11 years after reaching 7 billion. But across the globe, more countries are experiencing slowing or declining rates of population growth. The U.S. is no exception.
At the end of 2021, the Census Bureau announced that the U.S. population had grown by just 392,665 the previous year, an increase of just 0.1%. The Census Bureau pointed to the COVID-19 pandemic as one factor in this slow growth: excess mortality from the pandemic increased the number of deaths, while restrictions around travel and migration related to the pandemic limited growth from immigration.
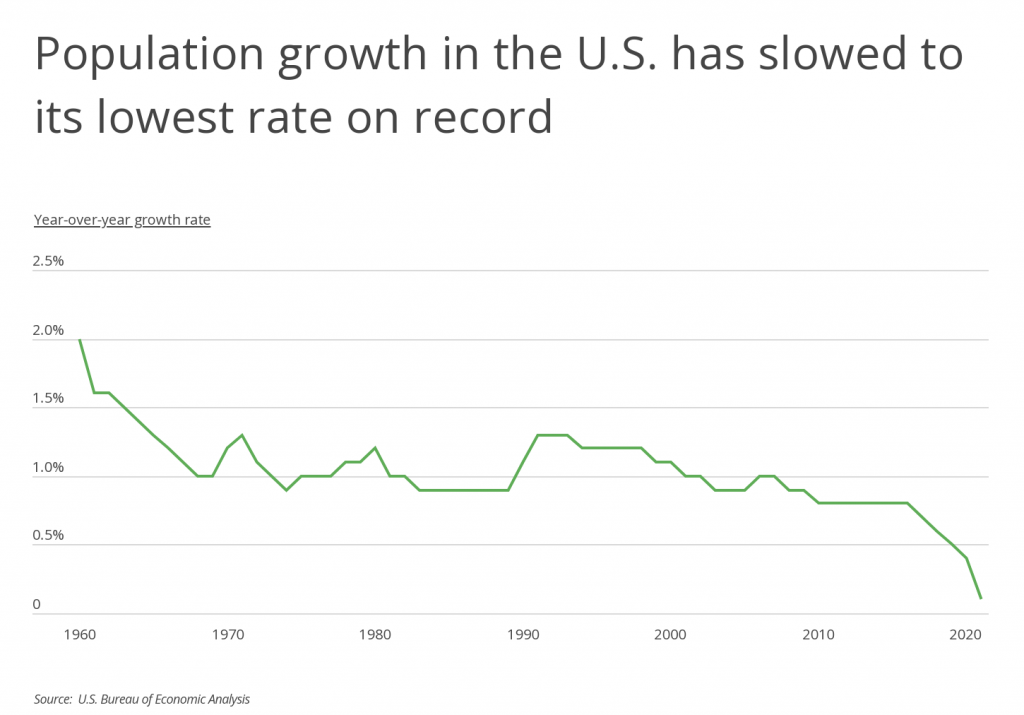
The current population growth rate of 0.1% is the lowest on record in the history of the U.S. And while COVID and other recent factors have contributed to the decline, the rate of population growth has been trending downward for years. Population growth fell off in the 1960s with the end of the Baby Boom. After a brief increase in the early 1990s, growth has been trending downward ever since.
One primary reason is a long-term decline in the fertility rate, a phenomenon common in high-income, developed economies. The U.S. fertility rate—calculated as the expected number of births per woman over a lifetime—sits at 1.6, which is below the rate of over 2.0 needed to sustain the population.
However, population trends in the U.S. vary along demographic and geographic lines. For example, nonwhite racial and ethnic groups—especially Hispanic and Latino Americans—still have relatively high rates of growth thanks to higher birth rates. And while international migration to the U.S. has declined overall, states like Florida, Texas, New York, and California continue to report large numbers of international immigrants.
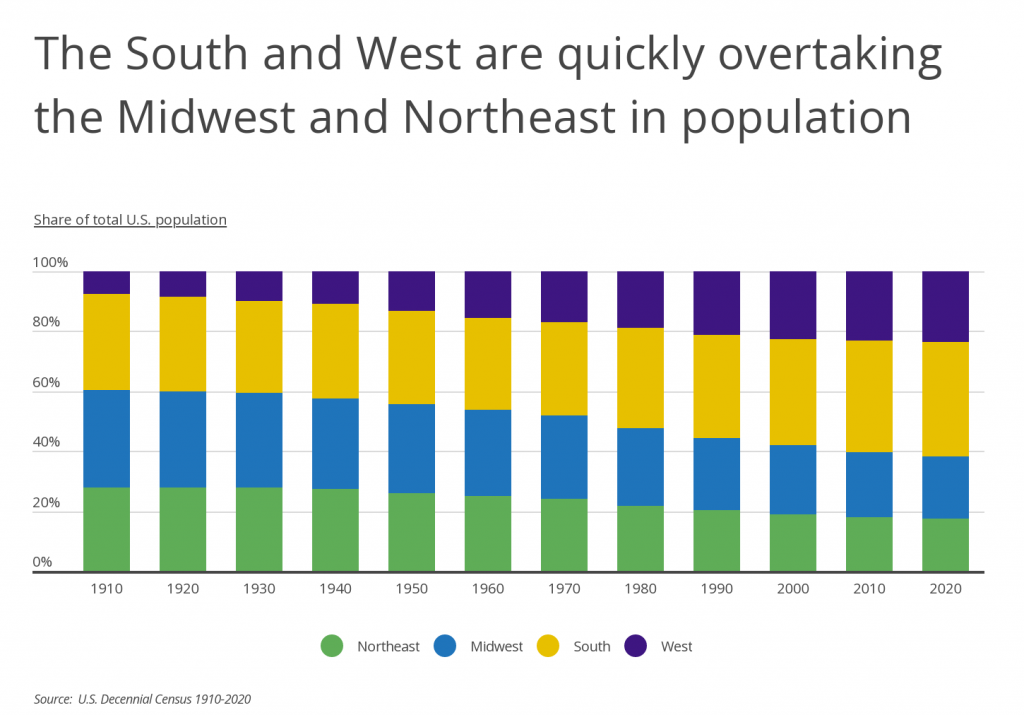
And within the U.S., where people are living continues to shift over time. Historically, the majority of the U.S. population was located in the Northeast and Midwest, but for the last hundred years, the share of Americans living in the South and especially the West has grown steadily. The West’s share of the population first hit 10% in 1930 but now sits at 23.7%. Much of the South’s growth has taken place in the last half century: from 1910 to 1970, the South’s share of the population hovered between 30% and 32%, but since then, the share of population has grown to 38.1%.
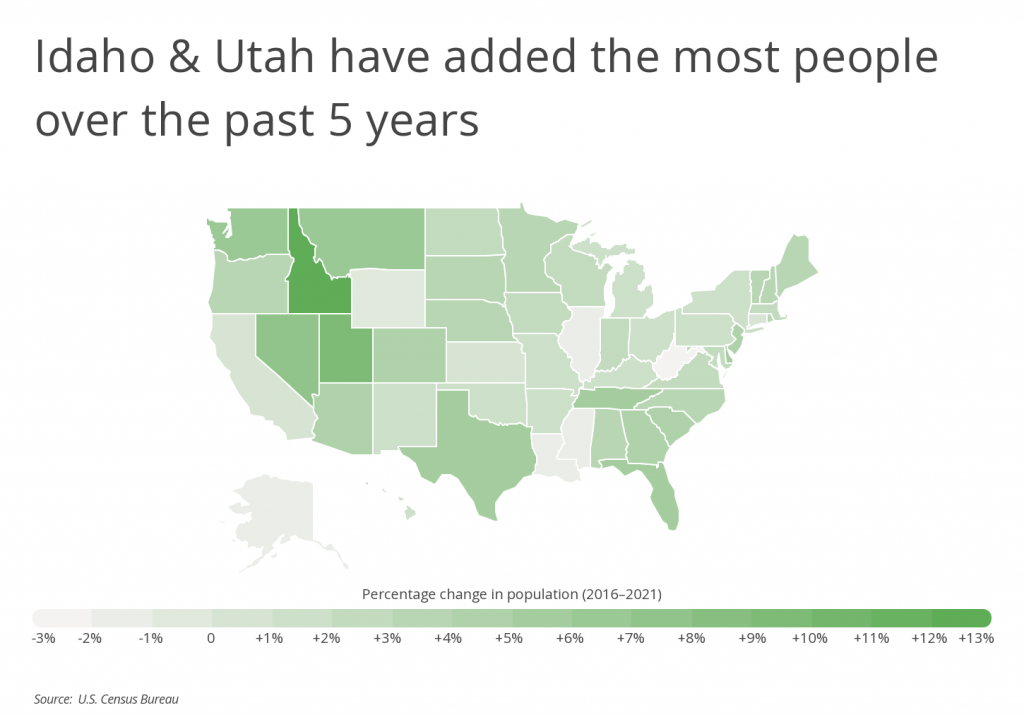
With these trends, it is unsurprising to see that the West and South host many of the states with the fastest rates of recent growth in the U.S. In the last five years, parts of the Mountain West region have seen explosive population growth. Idaho is the nation’s fastest-growing state, exhibiting a 13% growth rate from 2016 to 2021. Neighboring Utah, Nevada, and Montana are also among the fastest growers in the U.S. with respective growth rates of 9.7%, 7.8%, and 6.1%. The South is also home to a number of fast-growing states, led by Texas (5.8%) and Florida (5.7%). However, the Mountain West and South also had states that shrunk over the same time period, including Wyoming (-0.9%), Louisiana (-1.2%), and Mississippi (-1.3%).
At the local level, these regions are likewise well-represented among the list of fastest-growing cities. Of the top 15 fastest-growing large metro areas over the last five years, only the Indianapolis metro is located outside of the South and West. Texas is home to four of the fastest-growing cities, while Florida is home to three.
Data on population for 2016 and 2021 as well as migration patterns across metropolitan areas are from the U.S. Census Bureau. To identify which locations are the fastest-growing, researchers at Inspection Support Network calculated the percentage change in total population between 2016 and 2021. Researchers also calculated the most common origin for recent movers. All metropolitan areas from the U.S. Census with at least 100,000 people in 2021 were included in the analysis. Additionally, to improve relevance, metropolitan areas were grouped into cohorts based on population size: small (100,000–349,999), midsize (350,000–999,999), and large (1,000,000 or more).
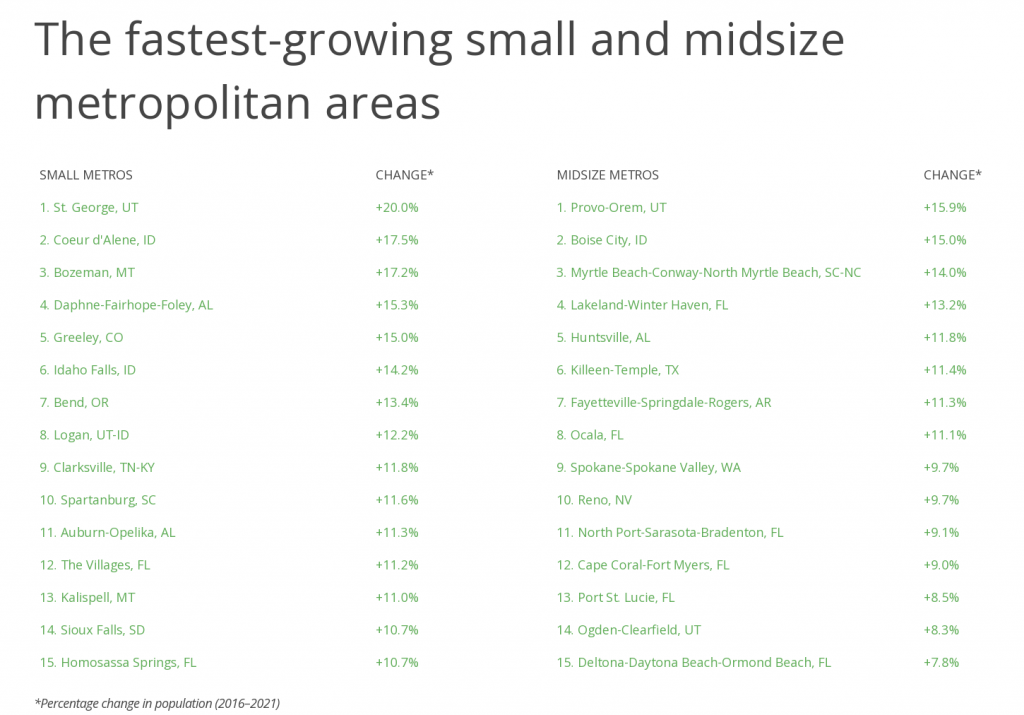
Here are the fastest-growing metropolitan areas in the U.S.
The Fastest-Growing Large Metropolitan Areas

Photo Credit: Henryk Sadura / Shutterstock
15. Tampa-St. Petersburg-Clearwater, FL
- Percentage change in population (2016–2021): +5.6%
- Total change in population (2016–2021): +170,551
- Population 2021: 3,219,514
- Most common origin for recent movers: Miami-Fort Lauderdale-Pompano Beach, FL

Photo Credit: Gregory E. Clifford / Shutterstock
14. Phoenix-Mesa-Chandler, AZ
- Percentage change in population (2016–2021): +5.8%
- Total change in population (2016–2021): +272,809
- Population 2021: 4,946,145
- Most common origin for recent movers: Los Angeles-Long Beach-Anaheim, CA

Photo Credit: Sean Pavone / Shutterstock
13. Houston-The Woodlands-Sugar Land, TX
- Percentage change in population (2016–2021): +5.9%
- Total change in population (2016–2021): +400,338
- Population 2021: 7,206,841
- Most common origin for recent movers: Dallas-Fort Worth-Arlington, TX
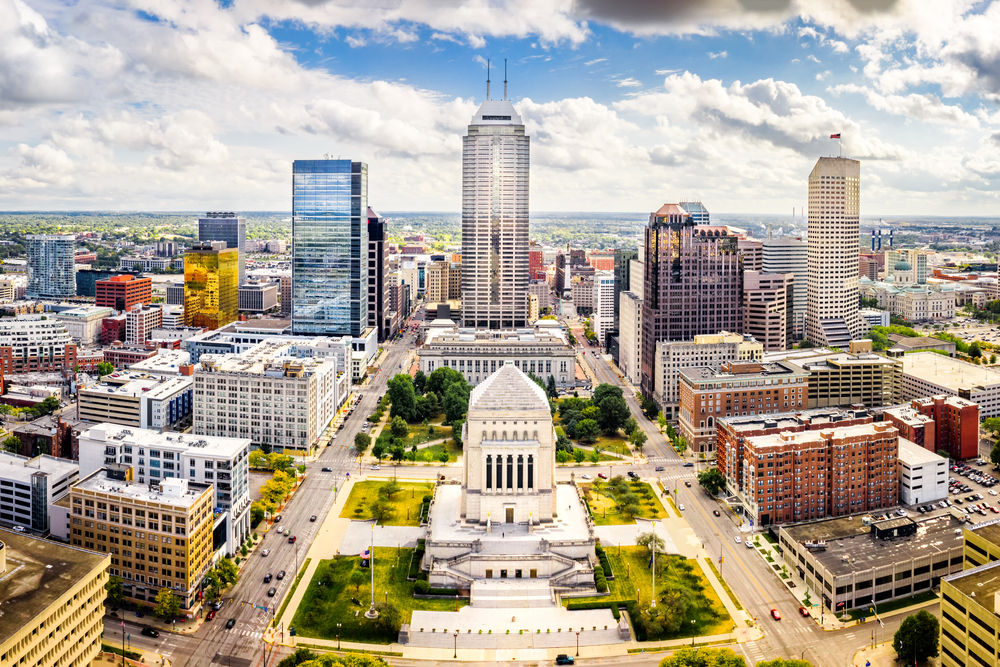
Photo Credit: Mihai Andritoiu / Shutterstock
12. Indianapolis-Carmel-Anderson, IN
- Percentage change in population (2016–2021): +6.0%
- Total change in population (2016–2021): +120,044
- Population 2021: 2,126,804
- Most common origin for recent movers: Chicago-Naperville-Elgin, IL-IN-WI

Photo Credit: Luciano Mortula – LGM / Shutterstock
11. Atlanta-Sandy Springs-Alpharetta, GA
- Percentage change in population (2016–2021): +6.2%
- Total change in population (2016–2021): +356,085
- Population 2021: 6,144,050
- Most common origin for recent movers: New York-Newark-Jersey City, NY-NJ-PA

Photo Credit: Lukas Bischoff Photograph / Shutterstock
10. Salt Lake City, UT
- Percentage change in population (2016–2021): +6.6%
- Total change in population (2016–2021): +78,340
- Population 2021: 1,263,061
- Most common origin for recent movers: Provo-Orem, UT
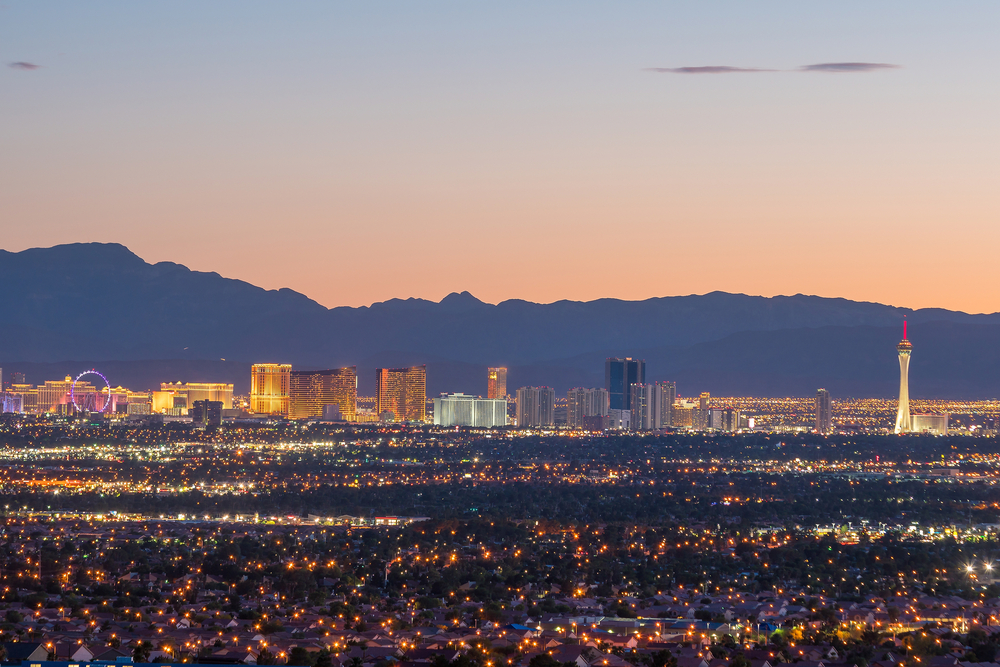
Photo Credit: f11photo / Shutterstock
9. Las Vegas-Henderson-Paradise, NV
- Percentage change in population (2016–2021): +7.2%
- Total change in population (2016–2021): +153,640
- Population 2021: 2,292,476
- Most common origin for recent movers: Los Angeles-Long Beach-Anaheim, CA
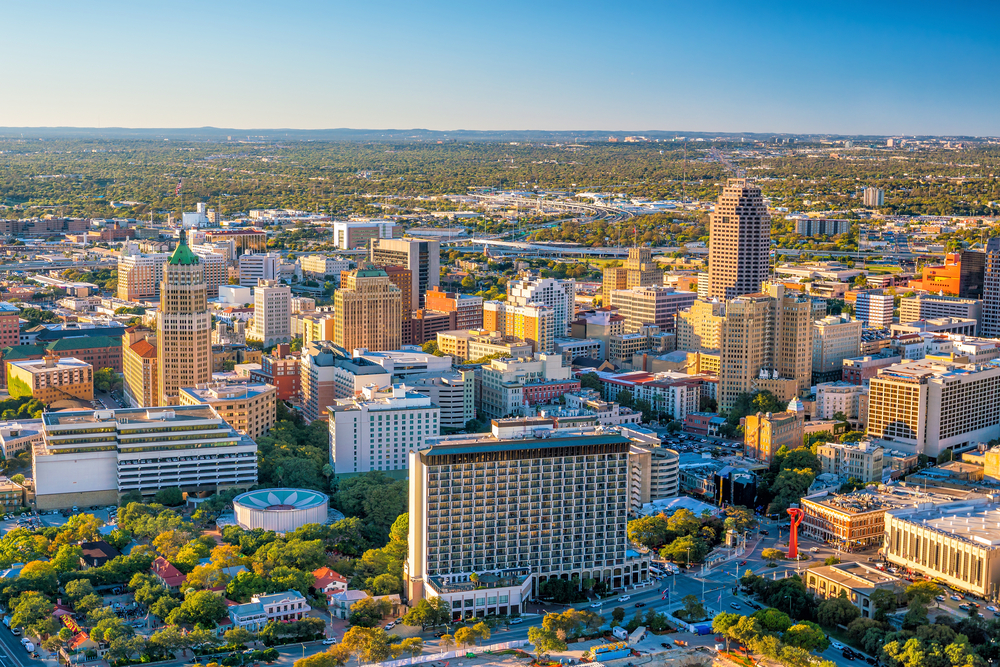
Photo Credit: f11photo / Shutterstock
8. San Antonio-New Braunfels, TX
- Percentage change in population (2016–2021): +7.2%
- Total change in population (2016–2021): +175,512
- Population 2021: 2,601,788
- Most common origin for recent movers: Houston-The Woodlands-Sugar Land, TX

Photo Credit: f11photo / Shutterstock
7. Dallas-Fort Worth-Arlington, TX
- Percentage change in population (2016–2021): +7.9%
- Total change in population (2016–2021): +564,857
- Population 2021: 7,759,615
- Most common origin for recent movers: Houston-The Woodlands-Sugar Land, TX
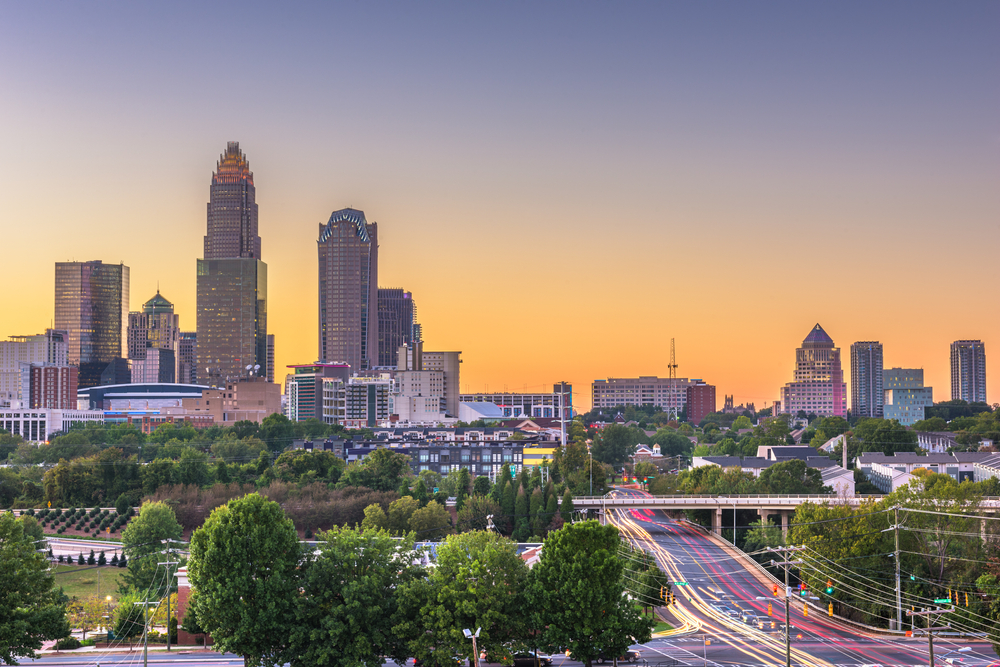
Photo Credit: Sean Pavone / Shutterstock
6. Charlotte-Concord-Gastonia, NC-SC
- Percentage change in population (2016–2021): +8.1%
- Total change in population (2016–2021): +201,349
- Population 2021: 2,701,046
- Most common origin for recent movers: New York-Newark-Jersey City, NY-NJ-PA
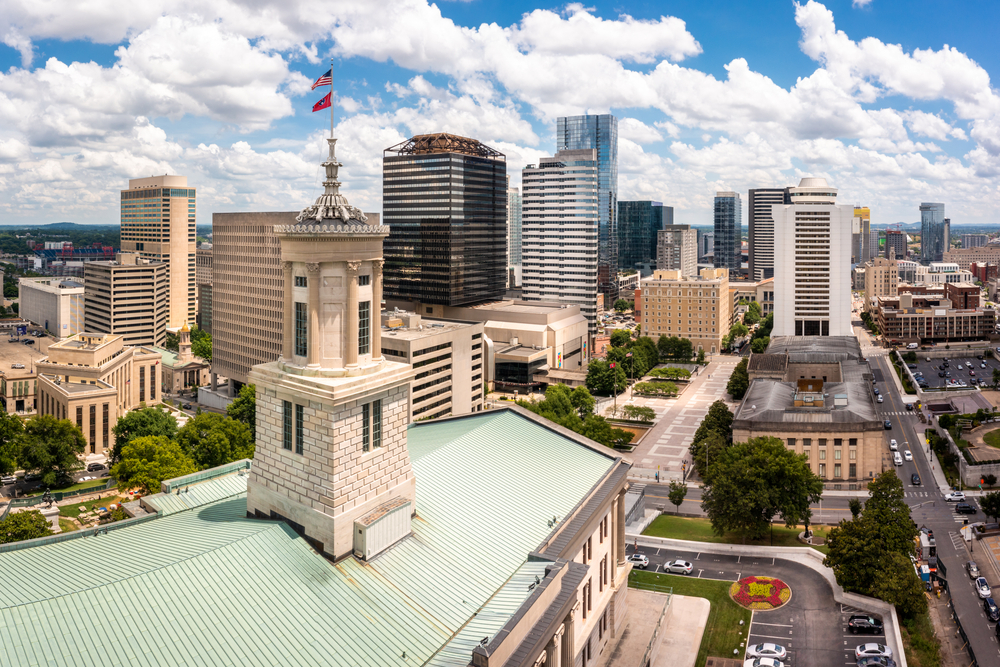
Photo Credit: Mihai Andritoiu / Shutterstock
5. Nashville-Davidson–Murfreesboro–Franklin, TN
- Percentage change in population (2016–2021): +9.3%
- Total change in population (2016–2021): +171,182
- Population 2021: 2,012,476
- Most common origin for recent movers: Knoxville, TN
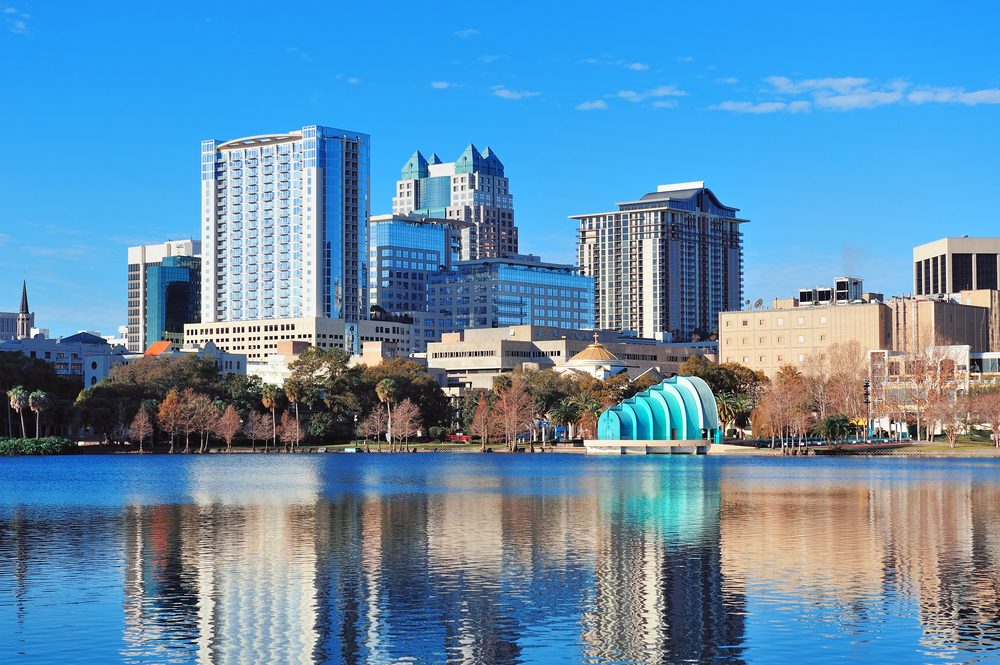
Photo Credit: Songquan Deng / Shutterstock
4. Orlando-Kissimmee-Sanford, FL
- Percentage change in population (2016–2021): +9.6%
- Total change in population (2016–2021): +236,342
- Population 2021: 2,691,925
- Most common origin for recent movers: Miami-Fort Lauderdale-Pompano Beach, FL
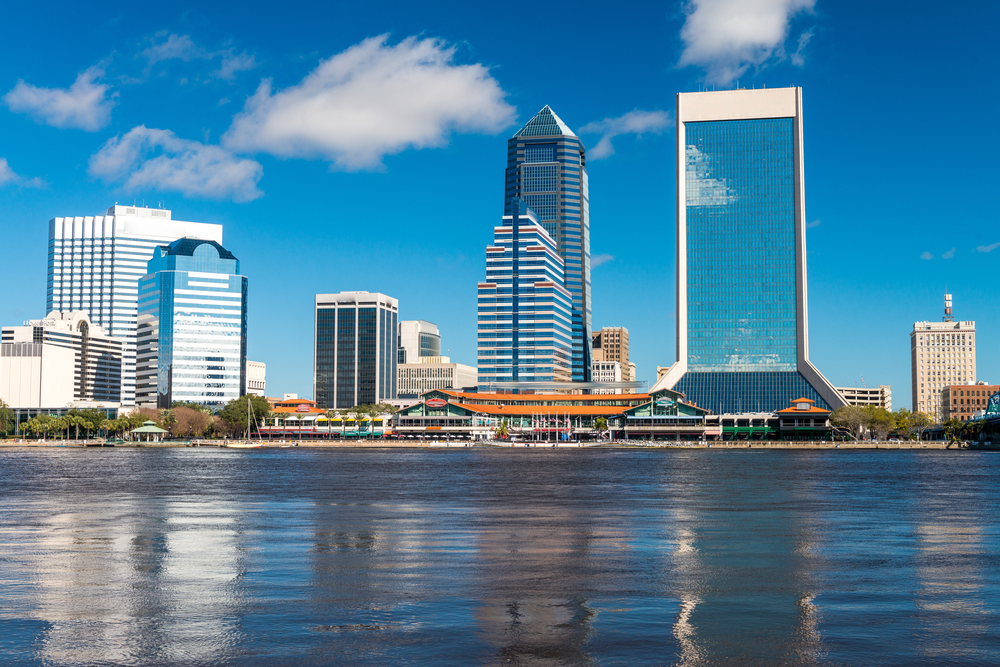
Photo Credit: GagliardiPhotography / Shutterstock
3. Jacksonville, FL
- Percentage change in population (2016–2021): +11.0%
- Total change in population (2016–2021): +161,643
- Population 2021: 1,637,666
- Most common origin for recent movers: Miami-Fort Lauderdale-Pompano Beach, FL
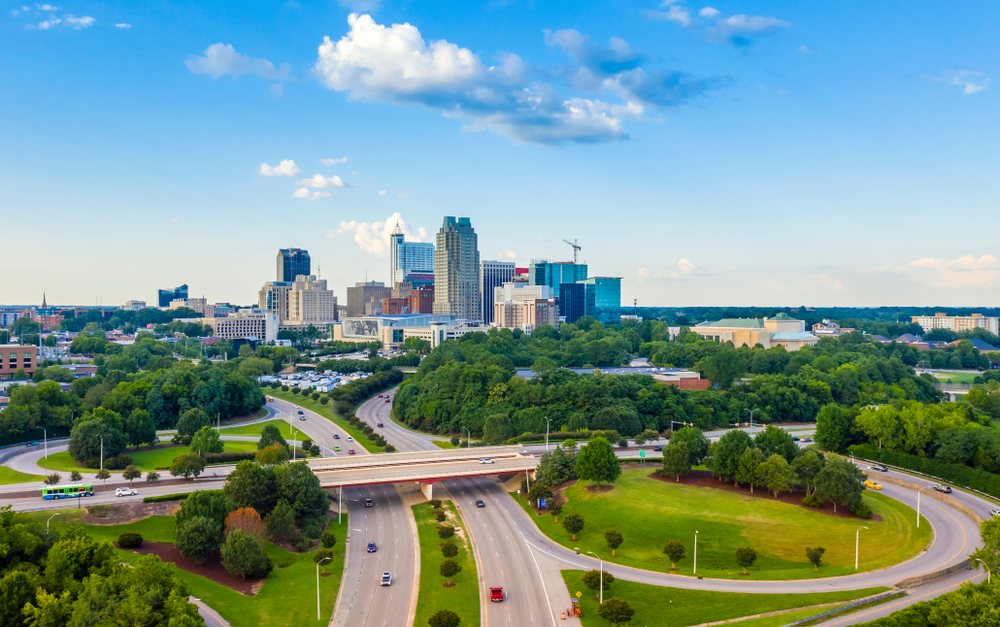
Photo Credit: Farid Sani / Shutterstock
2. Raleigh-Cary, NC
- Percentage change in population (2016–2021): +11.1%
- Total change in population (2016–2021): +144,557
- Population 2021: 1,448,411
- Most common origin for recent movers: Durham-Chapel Hill, NC

Photo Credit: Sean Pavone / Shutterstock
1. Austin-Round Rock-Georgetown, TX
- Percentage change in population (2016–2021): +14.1%
- Total change in population (2016–2021): +290,410
- Population 2021: 2,352,426
- Most common origin for recent movers: Houston-The Woodlands-Sugar Land, TX
Methodology & Detailed Findings
Data on population for 2016 and 2021 as well as migration patterns across metropolitan areas are from the U.S. Census Bureau. To identify which locations are the fastest growing, researchers at Inspection Support Network calculated the percentage change in population between 2016 and 2021. The most common origin for recent movers is the metropolitan area or state with the largest absolute number of movers using the most recent migration data available, which covers the period 2015–2019.
All metropolitan areas from the U.S. Census with at least 100,000 people were included in the analysis. Additionally, to improve relevance, metropolitan areas were grouped into cohorts based on population size: small (100,000–349,999), midsize (350,000–999,999), and large (1,000,000 or more).